Cycle Mobile Application
Problem
Create a wellness monitoring app that allows users to have full control and flexibility over what they choose to track while ensuring that the interface is straightforward and uncluttered, so users can easily use the app without feeling overwhelmed.
Constraints
Responsible Innovation: The solution must be responsibly innovative, a novel solution that strives to be usable to the widest range of people.
Role
Dates
Research Team
Background
As graduate students attending virtual classes due to the pandemic, we wanted to explore the problem space of mental health to see how we could help people manage their mental health and decrease stress. Several students reported feeling more lonely and isolated as a result of social distancing.
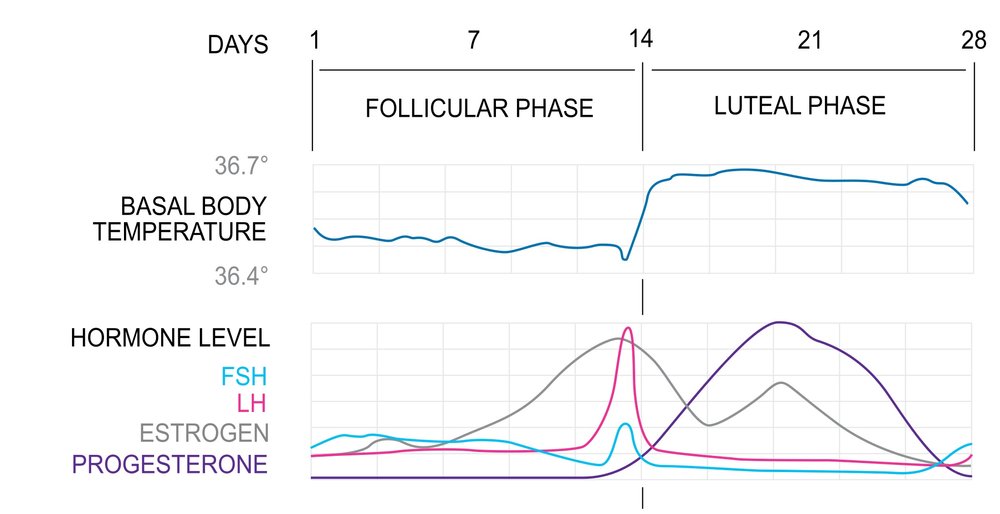
As females, we also recognize the impact of menstrual cycles on our mood and energy fluctuations. A typical menstrual cycle will last between 24-38 days. Two distinct menstrual cycle phases are the follicular phase (Day 1 - Day 14) and the luteal phase (Day 25 - Day 28). Women often experience marked differences in energy and mood levels within each phase based on varying hormonal levels. Women can experience different types of symptoms during menstruation, but tracking consistently over time can reveal unique patterns for each individual.
Secondary Research
We began our research by reviewing existing literature on mental health technology (MHT). A key finding was an increased need for MHTs to incorporate customization to improve user adherence. Although many MHTs exist, there is very little evidence to support the clinical efficacy of these tools. Systems that can adapt and tailor to users’ needs can enhance user engagement and clinical effectiveness. However, customization is only desirable when the required user effort does not exceed users’ mental and motivational capacity [1].
Surveys
We built our survey to target the graduate student population. Our goal was to uncover whether most students used MHTs, the type of MHTs they used, and for what purpose they used them. In addition, we included short-answer questions to find out what features students liked and disliked about current tools. For surveyees who experienced a menstrual cycle, we added questions to see if their menstrual cycle affected their stress and mental health.
We received 31 responses from our survey. 90% of respondents identified as female. The largest age group was 25-34 (55%), and the second largest age group was 18-24 (36%).
74% of survey respondents who identified as female agreed that their menstrual cycle has an impact on their mood
61% of respondents said their menstrual cycle affects their stress levels, and 90% of those respondents noted that stress increases
Respondents appreciated the easy access to psychoeducation and support. They also reported that MHTs encourage them to build wellness habits because they don’t want to break their “streak.” However, some MHTs are still expensive, and they find the tools difficult to customize to their personal goals.
“It was very busy. There’s so many options and categories and possibilities of things to track that it became overwhelming and I dropped it all together.”
Survey write-in response > what do you dislike about MHTs?
Competitive Analysis
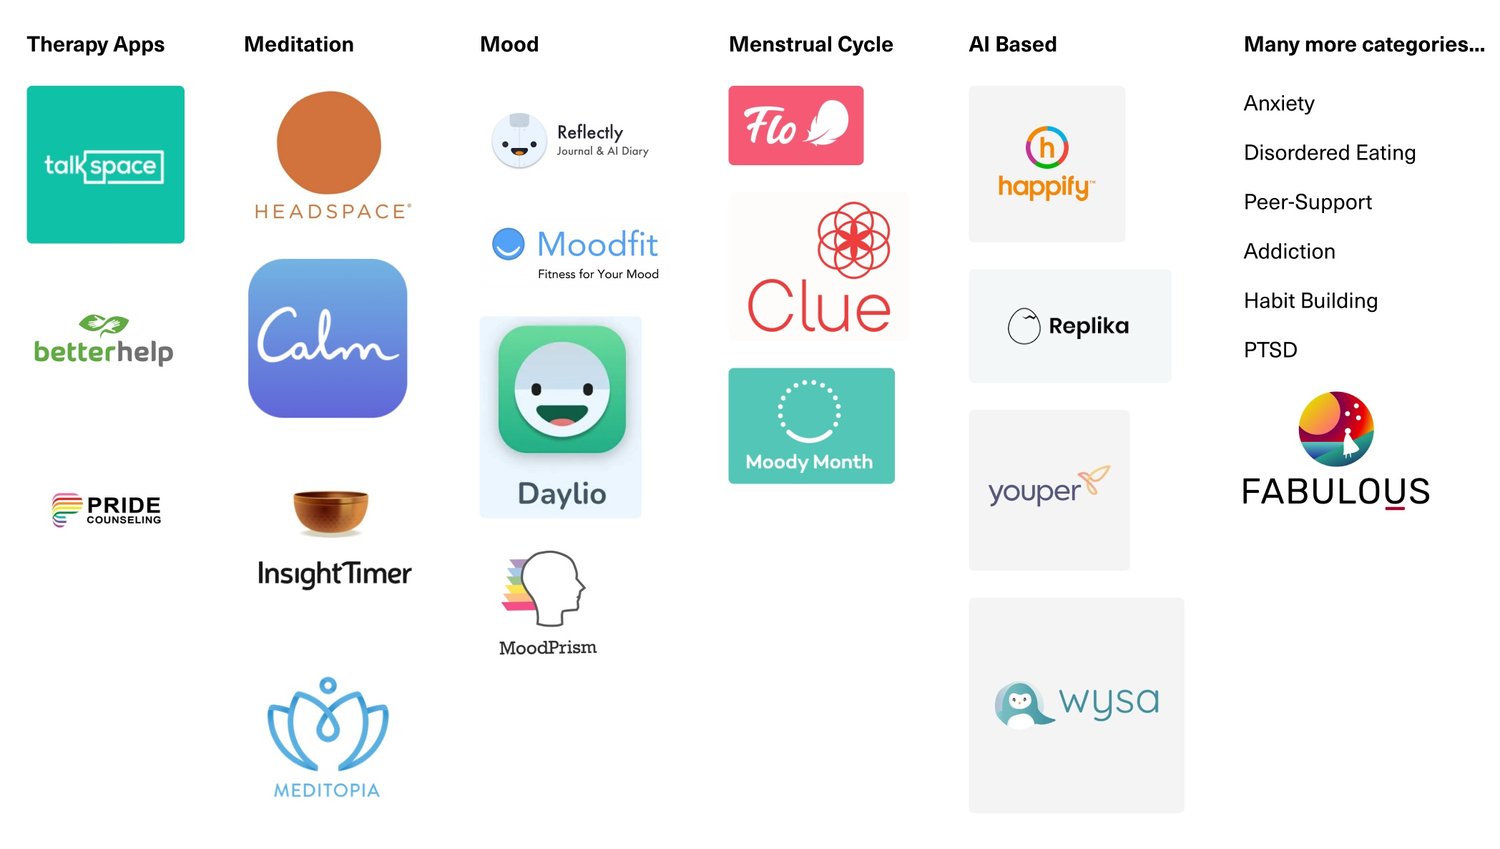
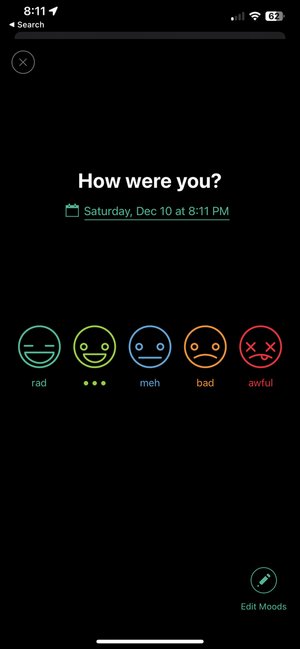
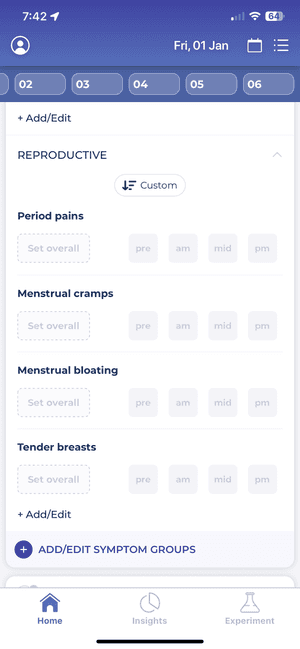
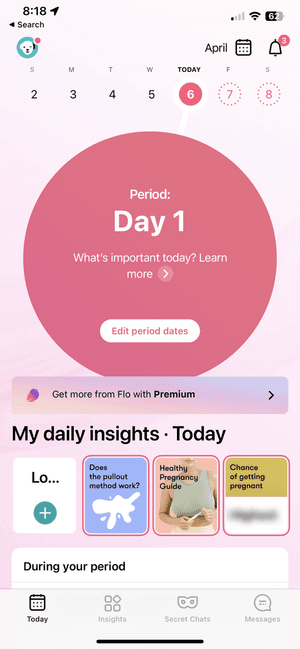
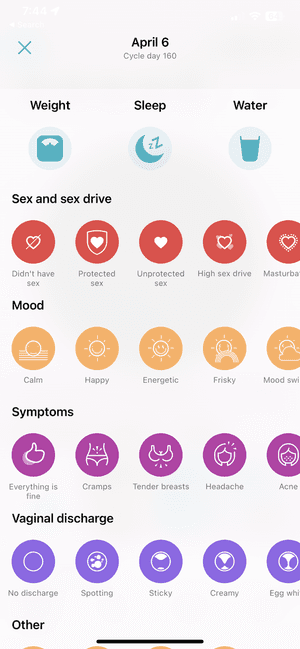
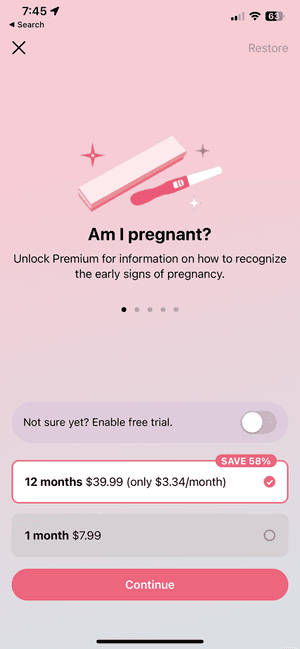
We analyzed existing mental health technologies (MHTs) to evaluate their features. We noticed that menstrual tracking applications did not incorporate wellness features beyond symptom tracking and fertility planning. Those that offer mood tracking limit users to preset options. Mood-tracking applications allowed for the most customization, but their interfaces were complicated and required more work from the user to gain actionable insights. Moreover, activity tracking - which can influence mood and mental health - was typically absent from most menstrual cycle trackers.
Mood, activity, and menstrual cycle tracking applications are often separated, making it difficult for users to gain a comprehensive understanding of the various factors that can impact their mental health.
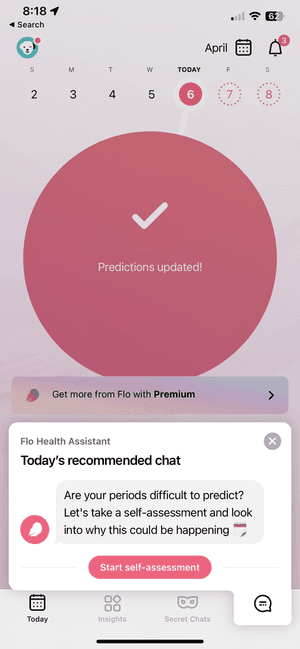
Personalization is frequently a premium feature in apps, adding extra cost for users. Apps also generate content to engage active users, but this content can create friction for users when they perform routine tasks such as logging their data.
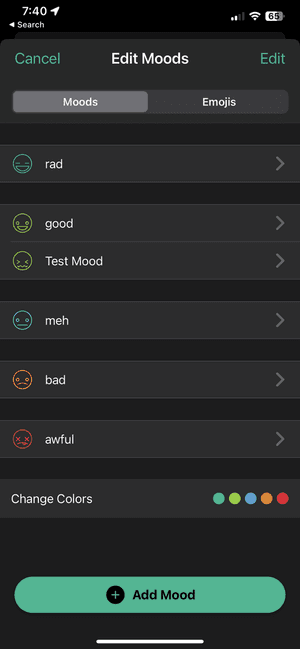
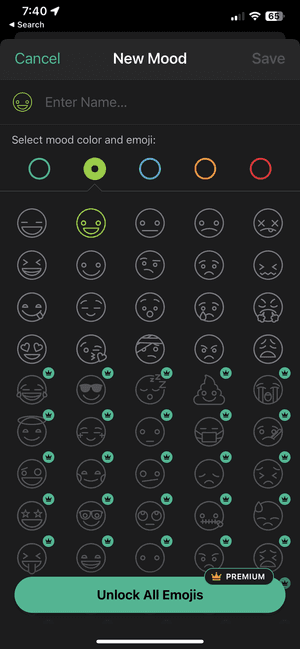
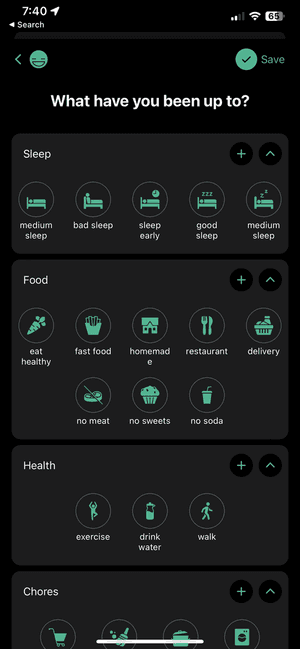
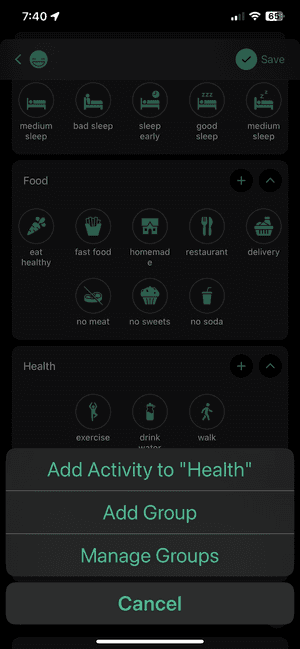
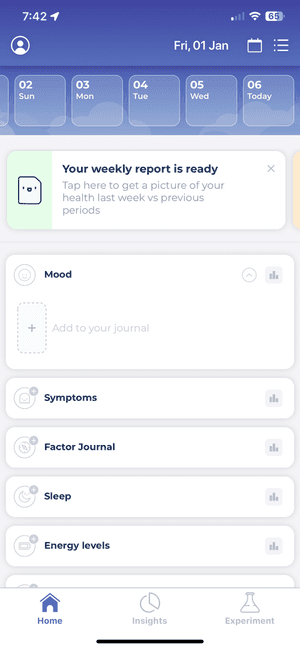
Example from Daylio, a mood tracking app
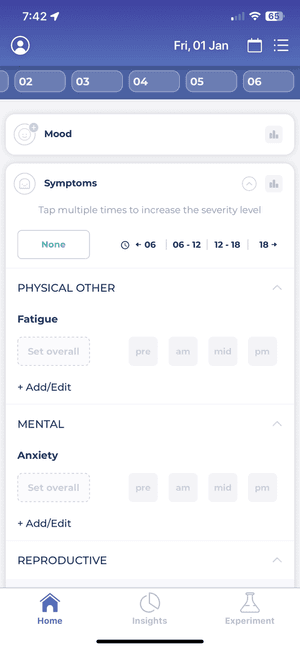
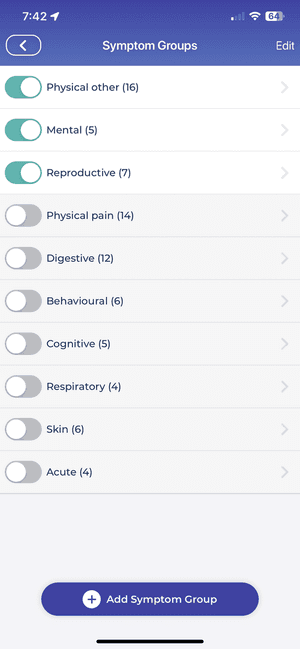
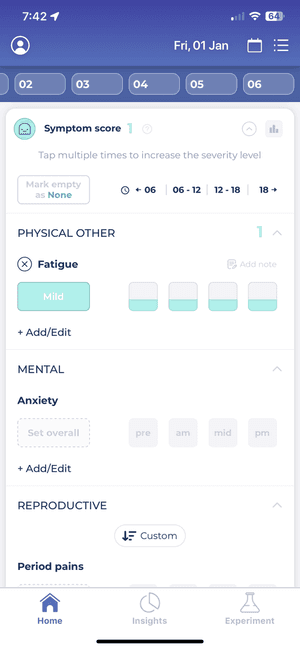
Example from Bearable, a symptom tracking app
Example from Flo, a fertility and menstrual cycle tracking app
Primary Persona
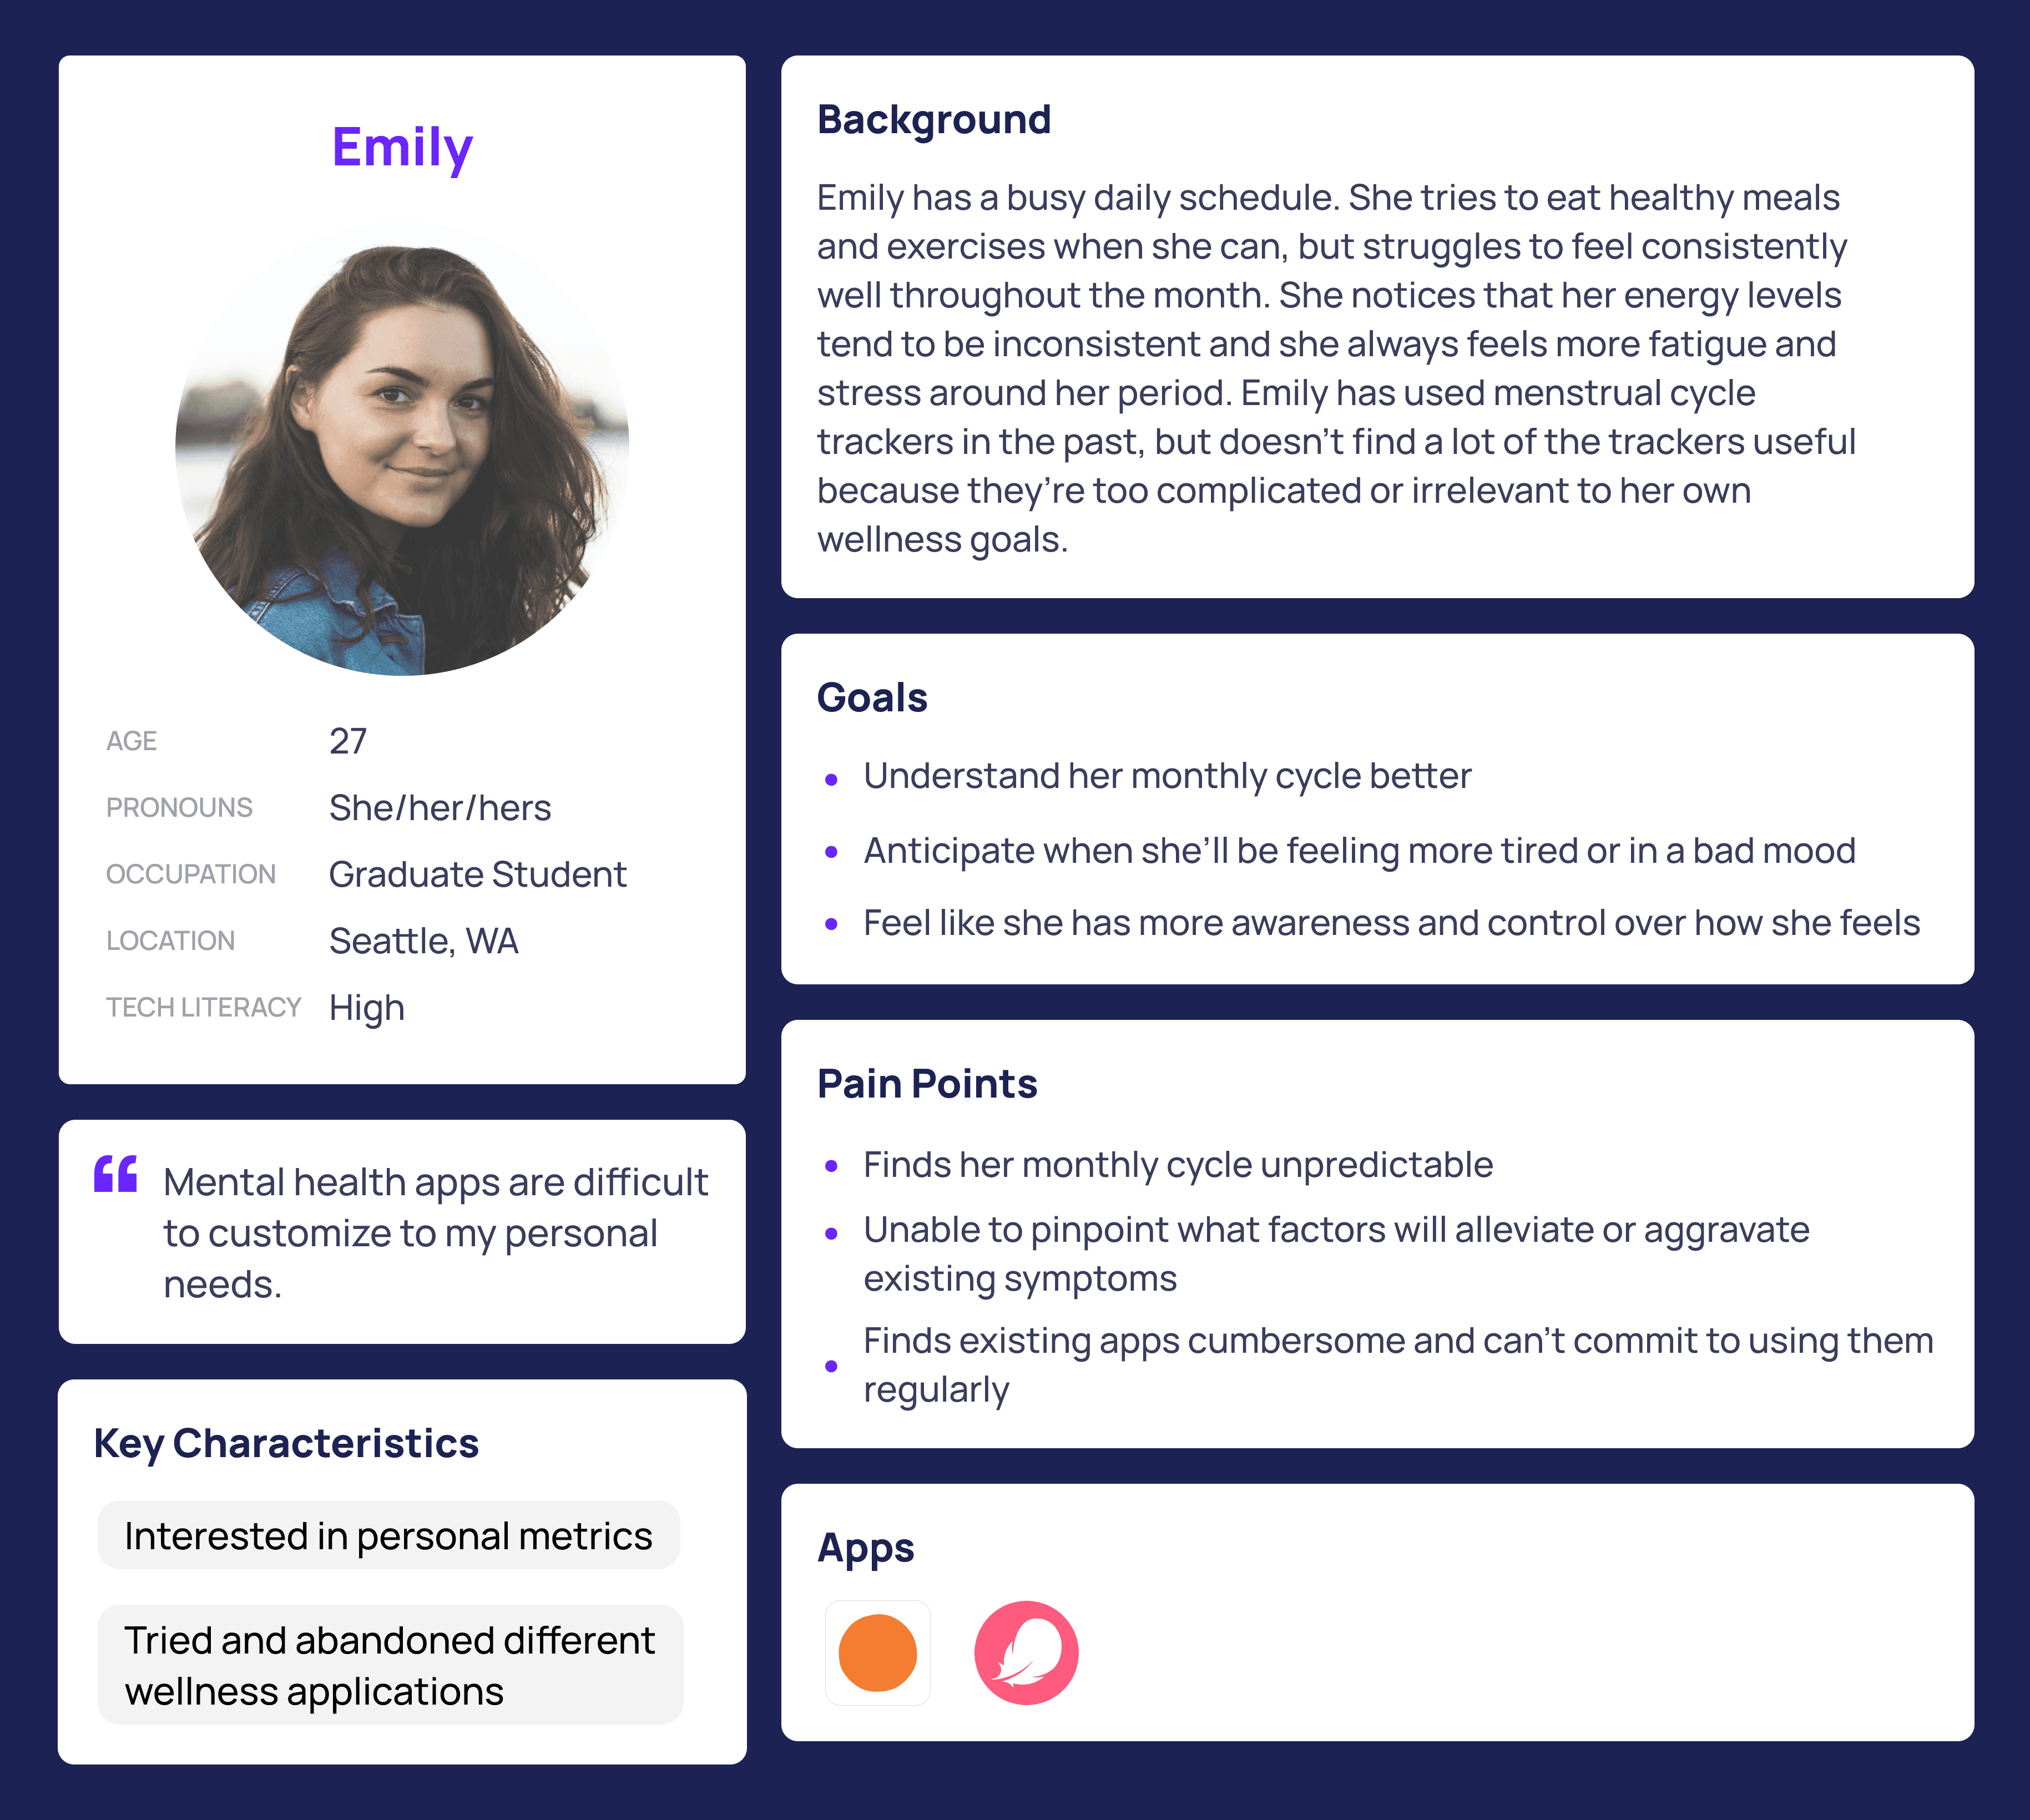
We developed a qualitative persona based on our user research. Our persona is a technically fluent individual who experiences regular menstrual cycles with a wide range of symptoms. She finds it difficult to anticipate her mood or energy levels and would benefit from more insights into her cycle.
Use Cases
Menstrual Cycle Tracking: Primary use case for this application would be to support menstrual cycle tracking. Users can track anything that affects their monthly cycle.
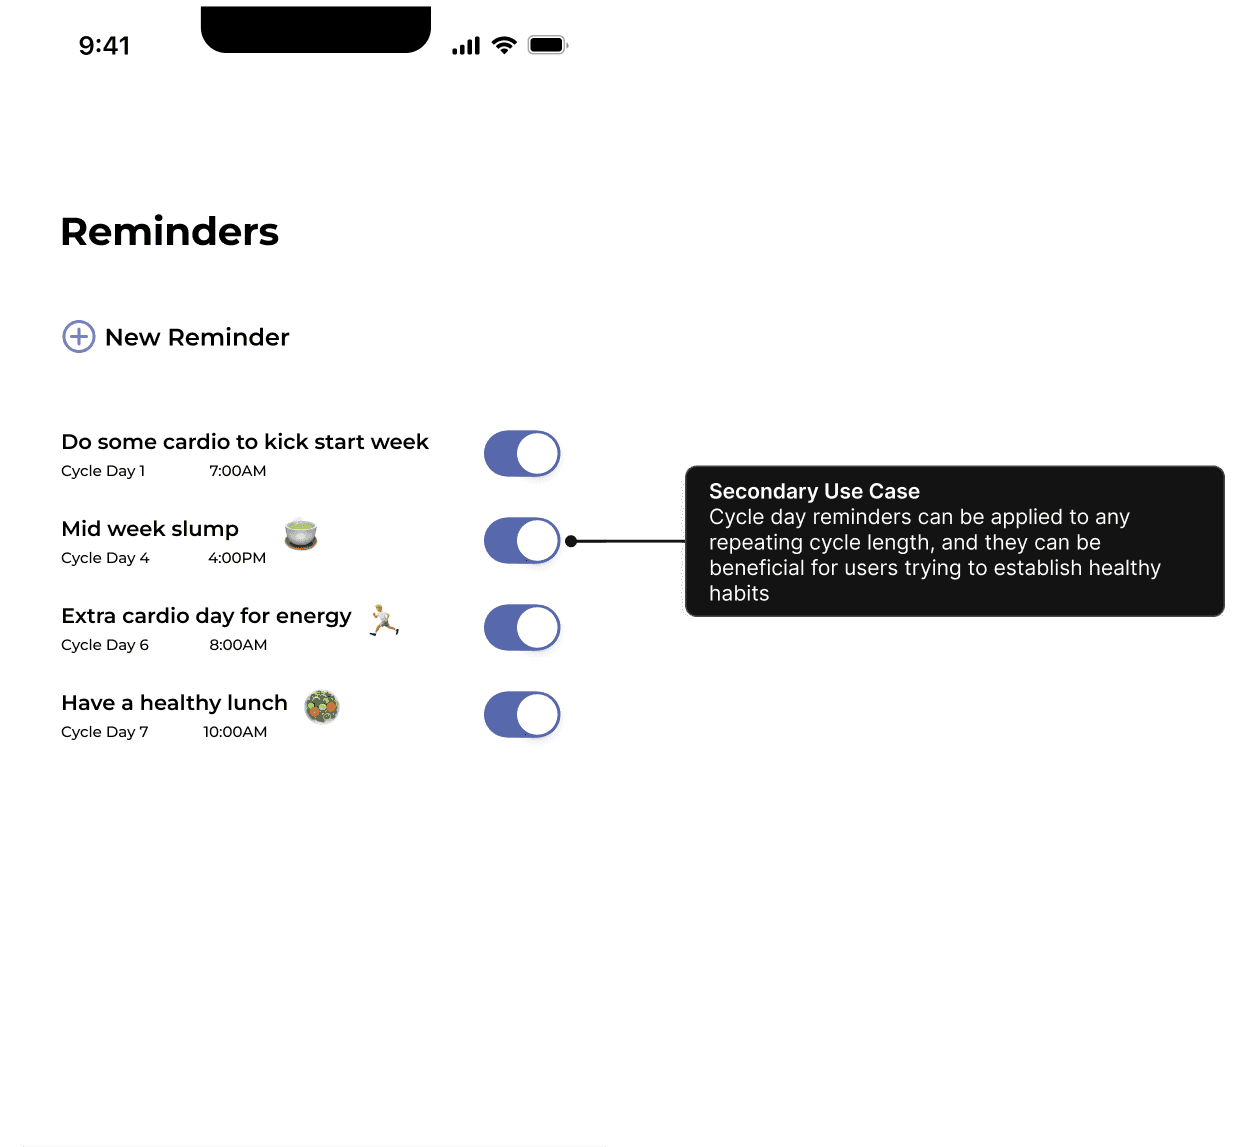
Habit Cycle Tracking: Secondary use case can generalize a cycle to be repeating durations that correspond with lifestyle routines.
Context Scenarios
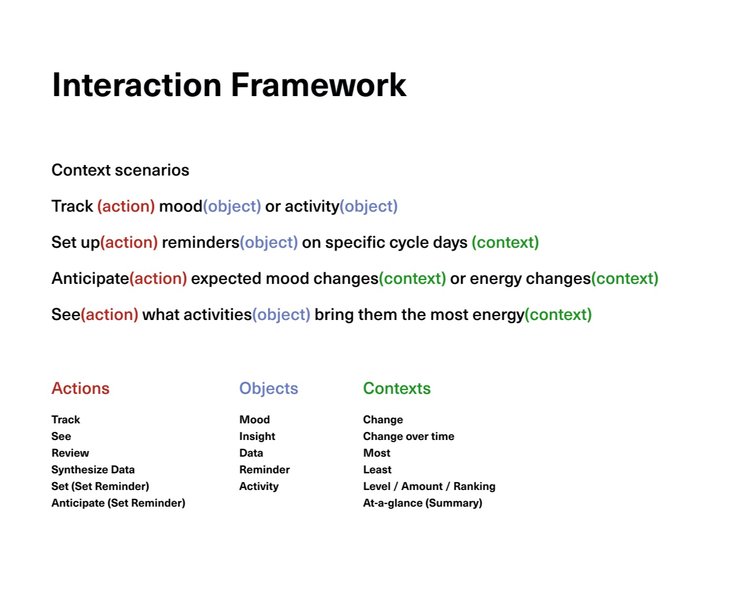
I use context scenarios to define the interaction framework and screen flows before ideating with sketches. Context scenarios are also used to extract design requirements.
Design Requirements
Simple: Don’t overwhelm users with options. Reduce perceived complexity by minimizing visual noise and reusing elements.
Flexible: Experience can be customized to support different goals.
Interactions
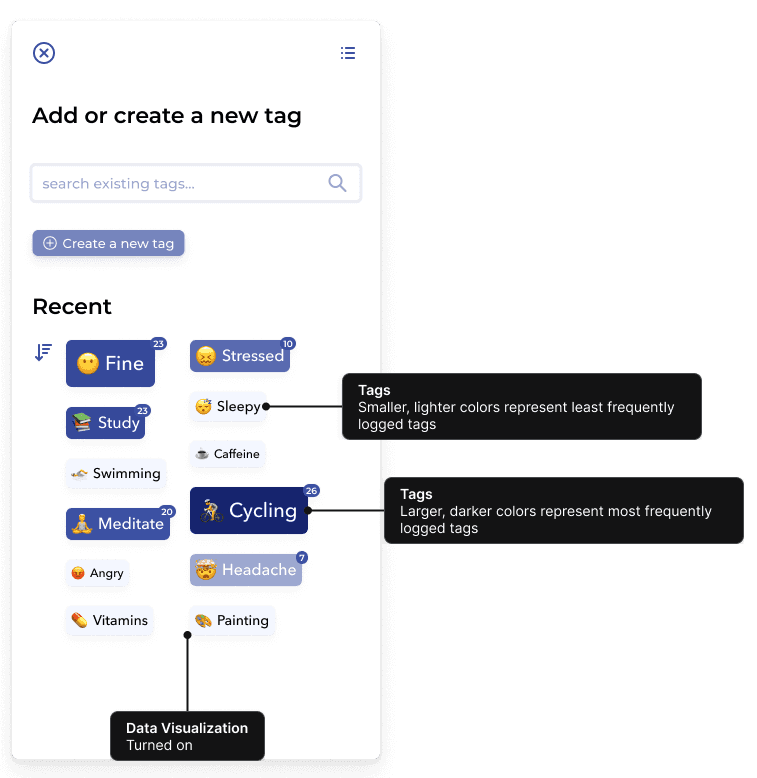
Log tags with data visualization
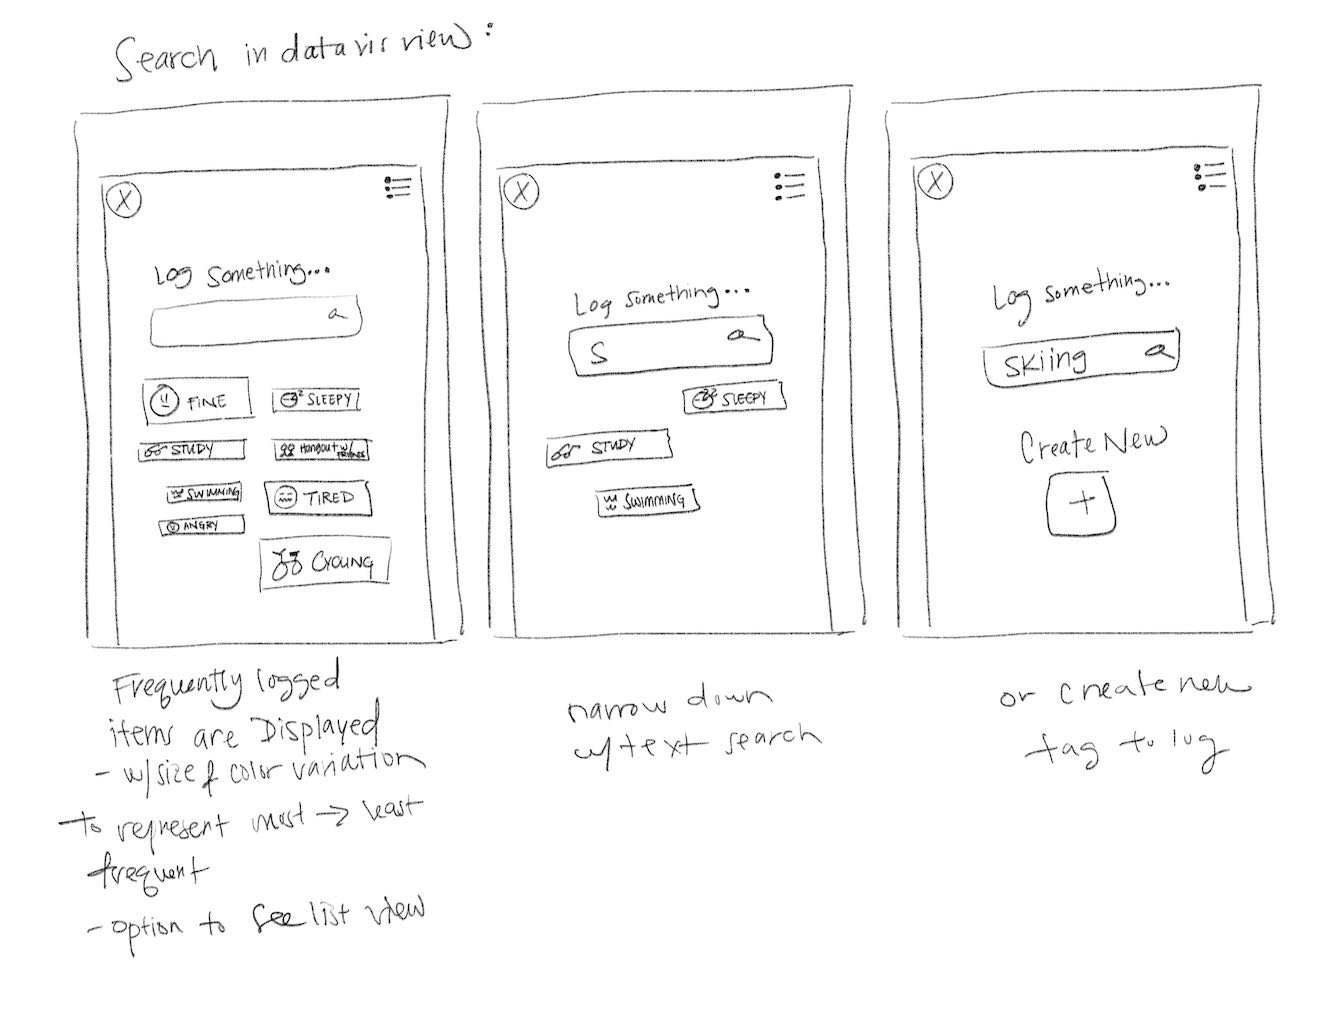
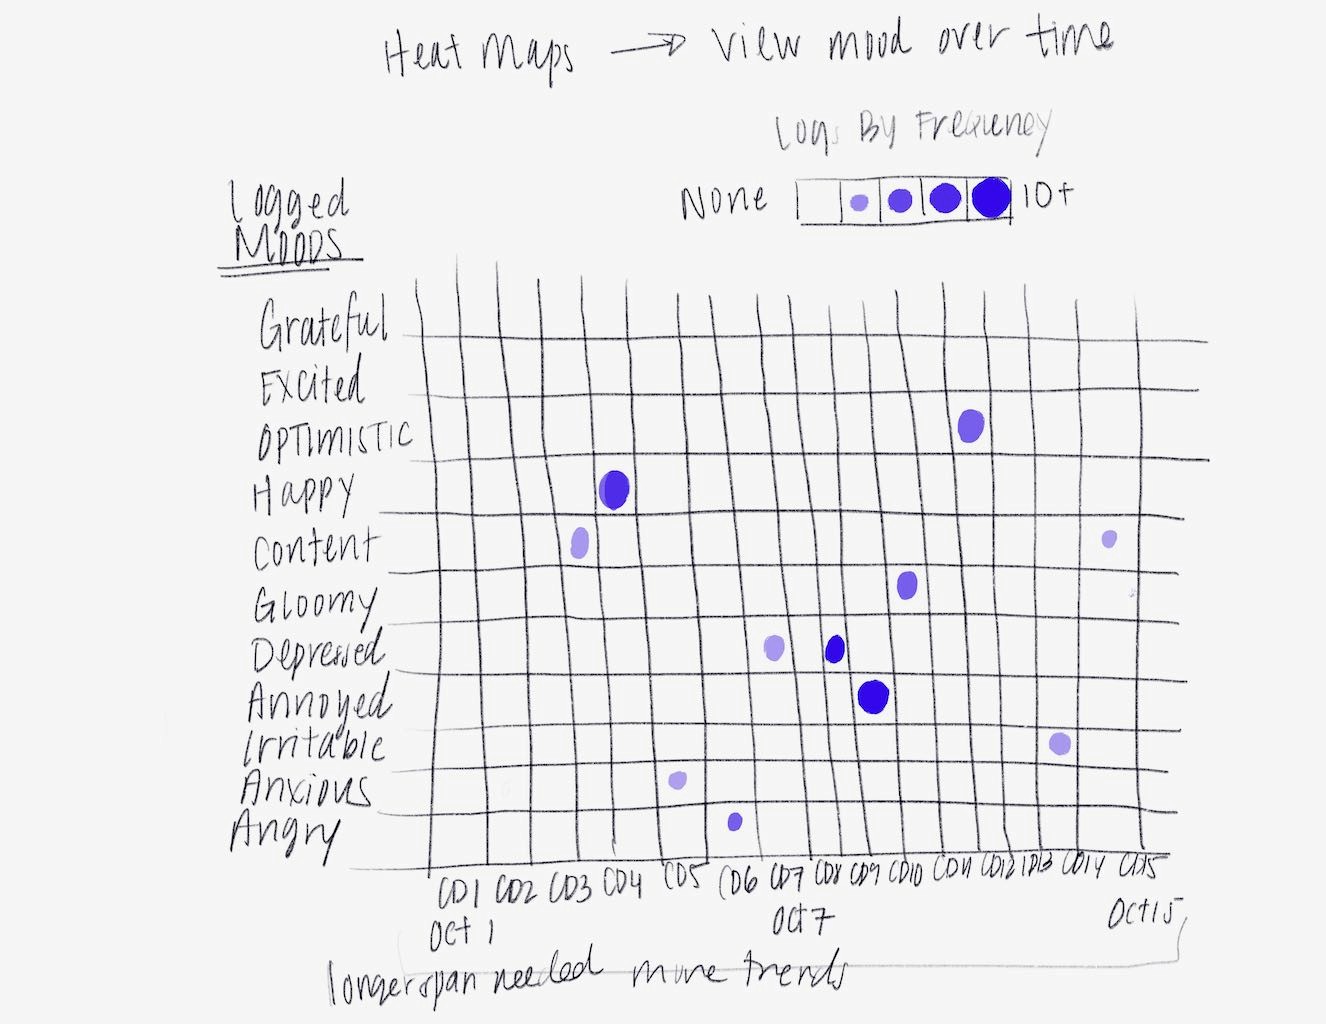
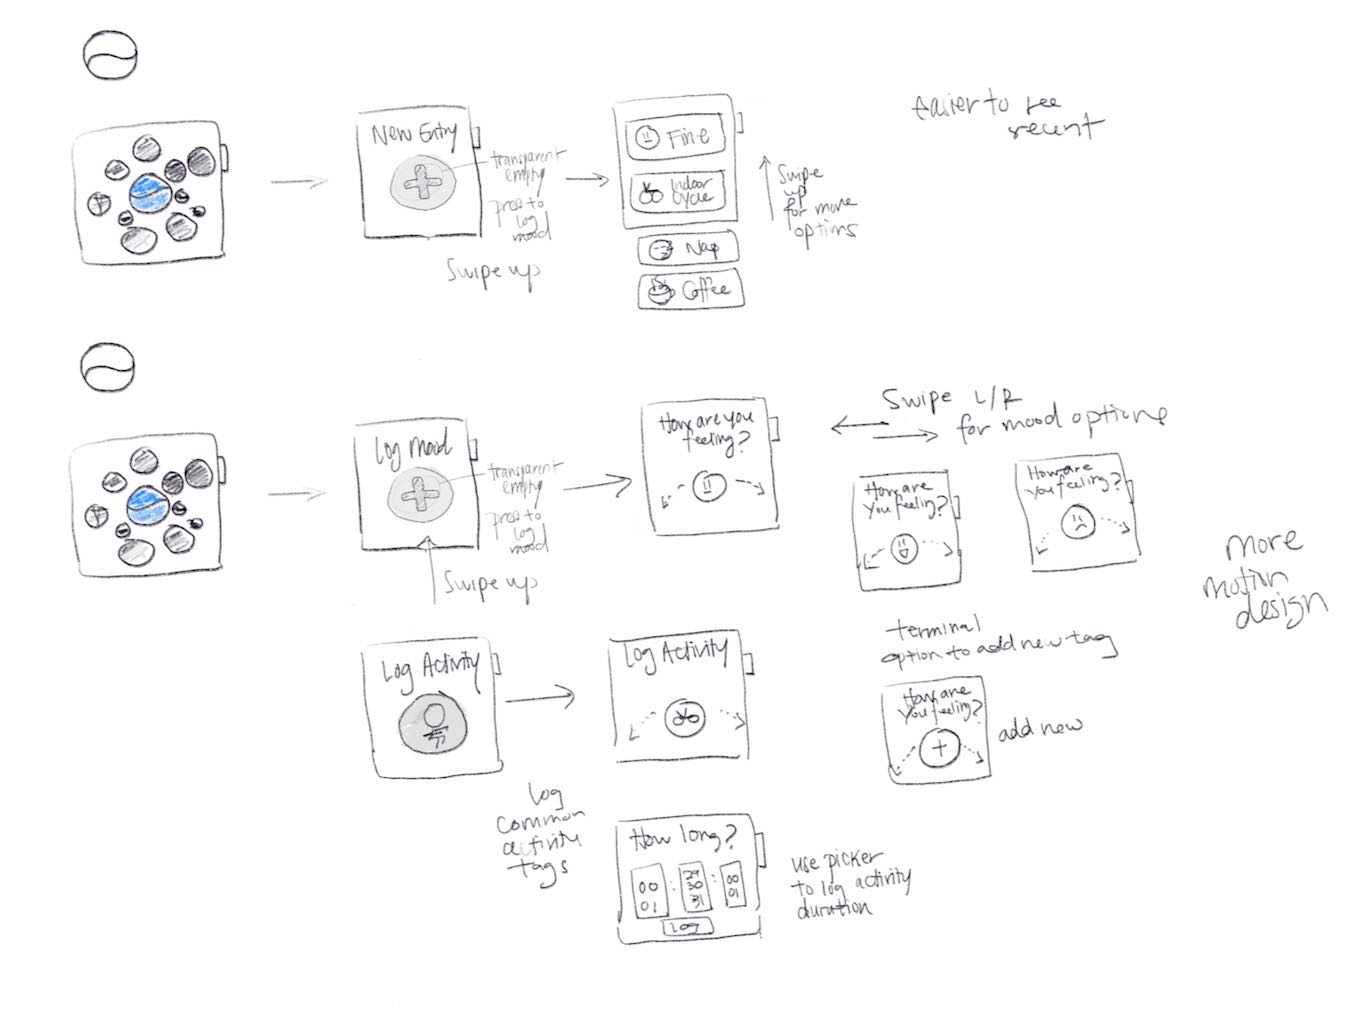
I wanted to explore how we could combine routine interactions (data-logging) with data visualization to surface patterns to the user without requiring additional time or work. Many existing applications offer different charts and statistics that users can review to find patterns, but reviewing and logging data are two separate steps. Users would need to spend additional time on top of logging data to gain insights. My goal was to change the interaction so that users could gain insights while they log data.
Calendar views
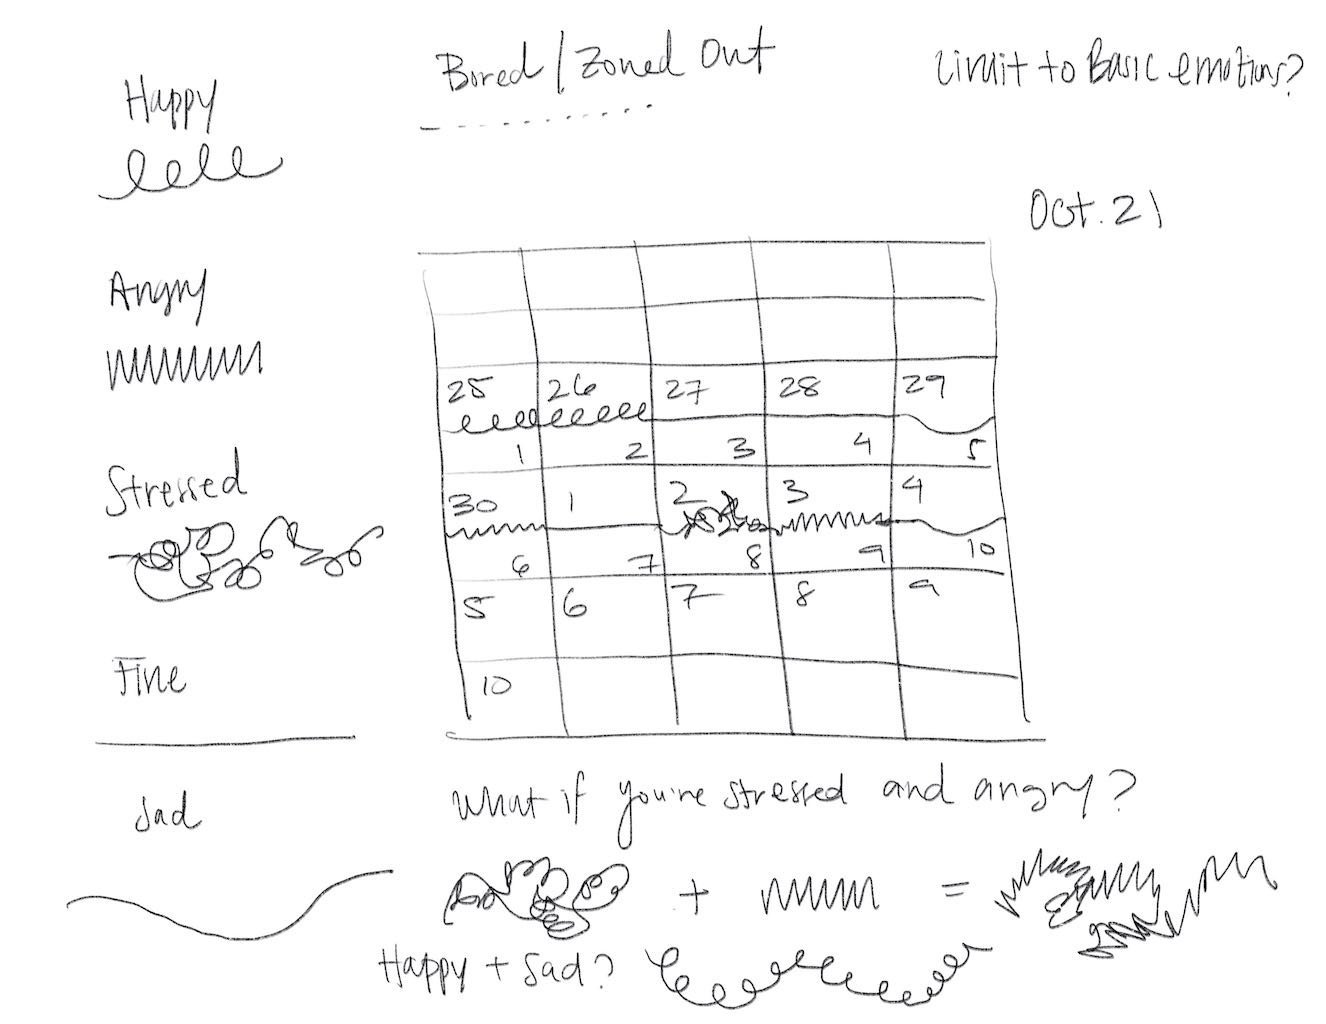
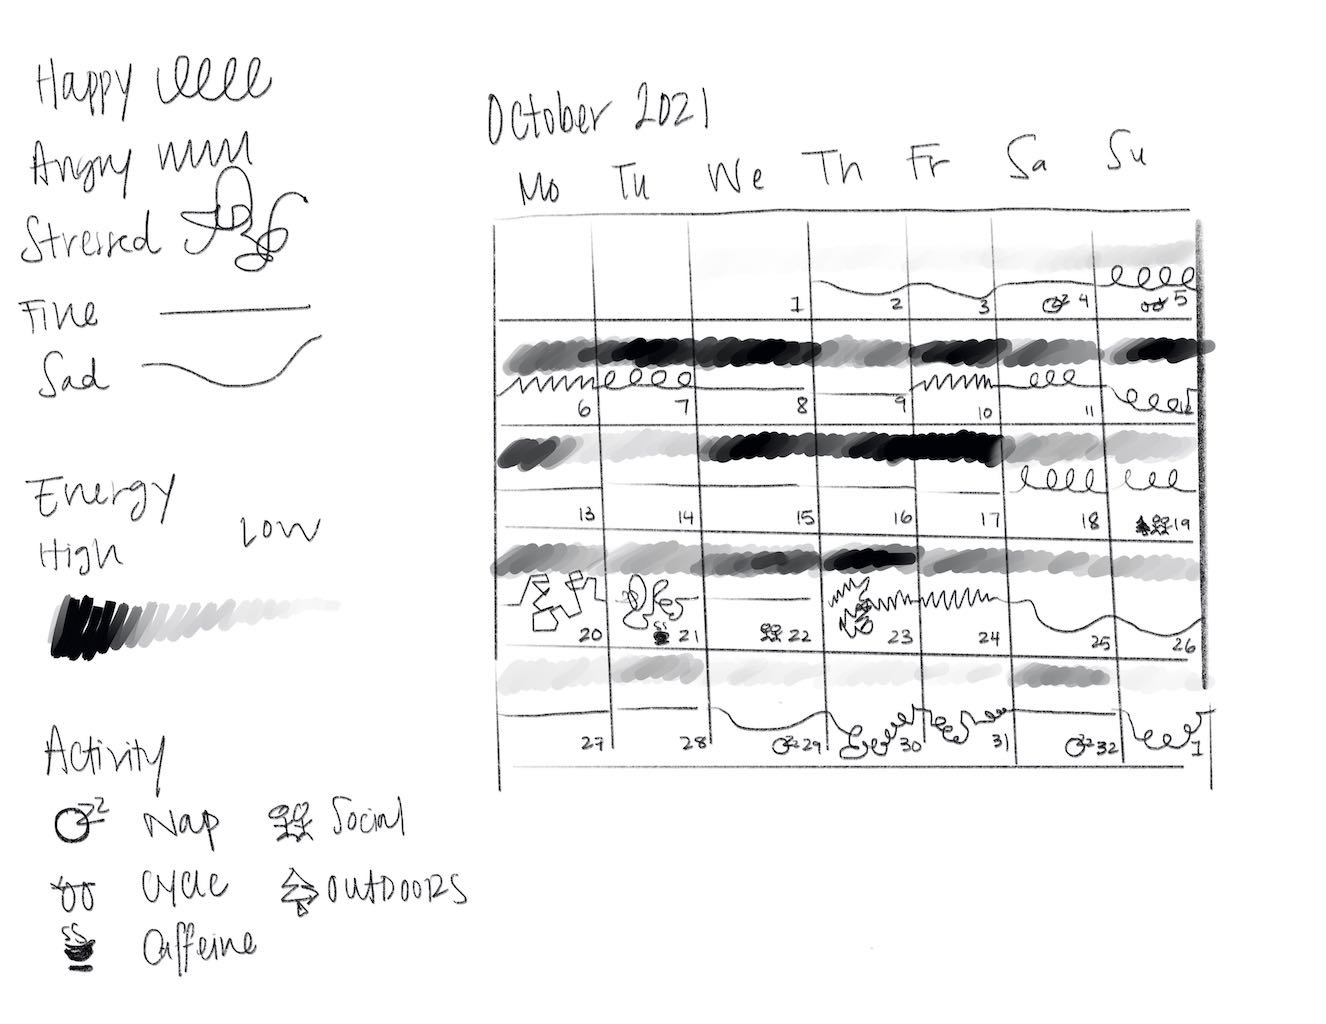
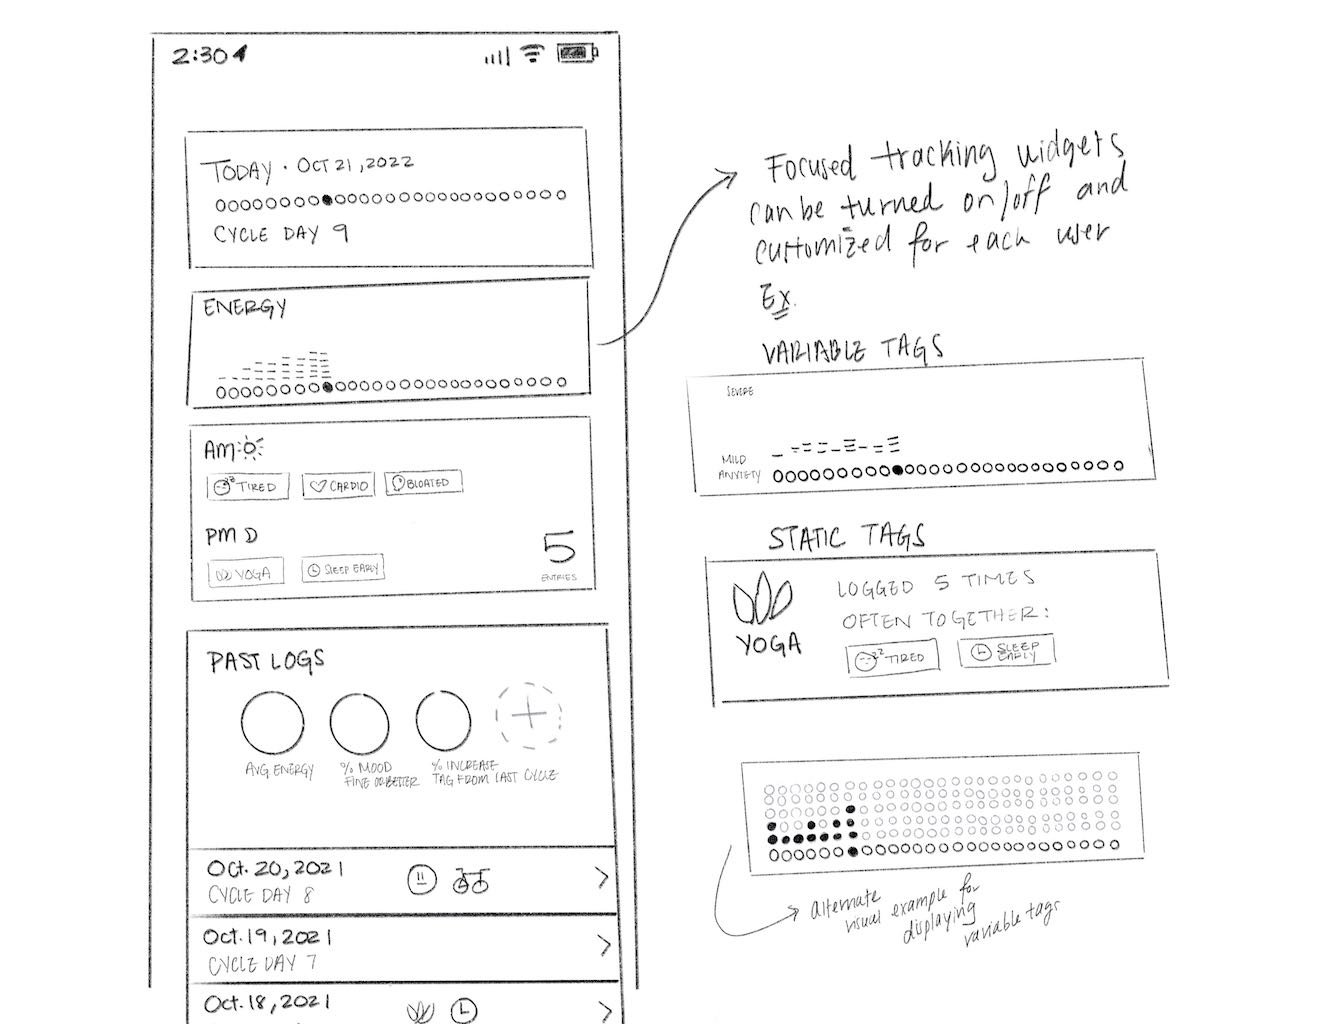
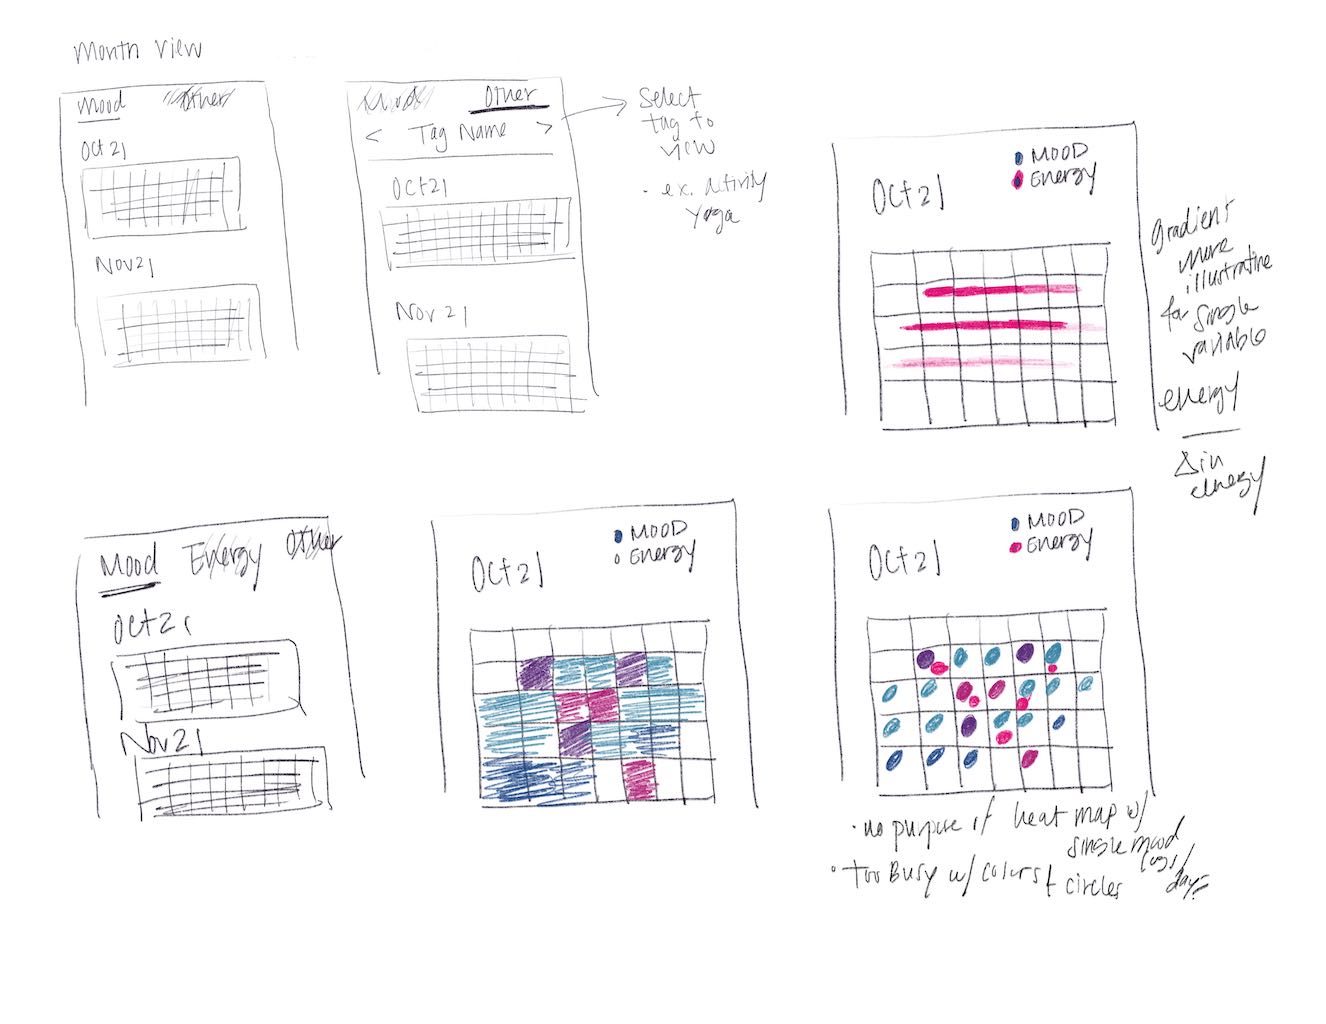
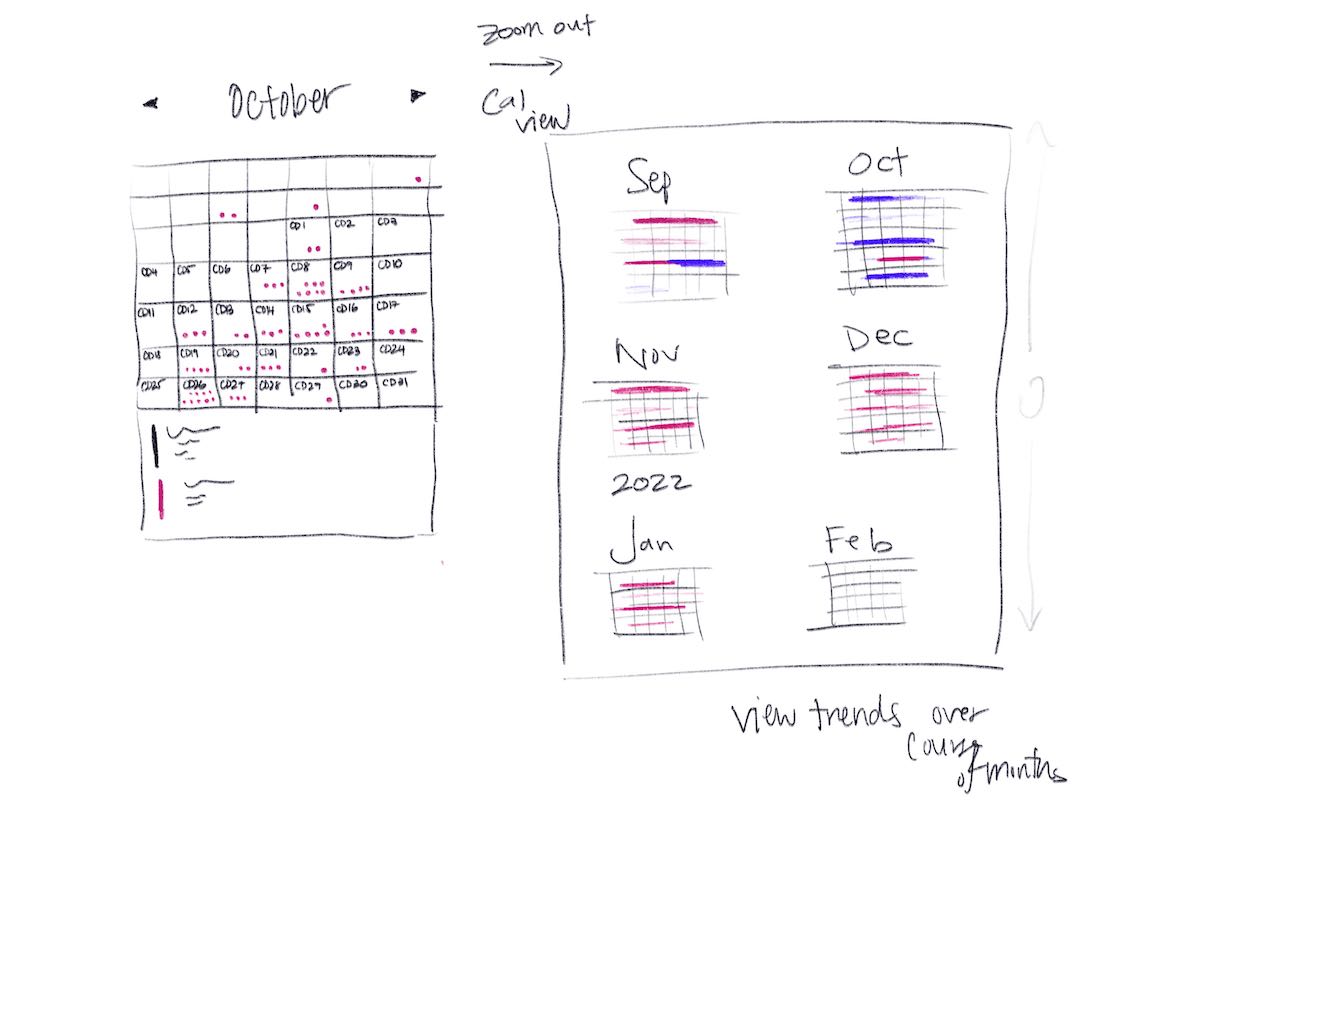
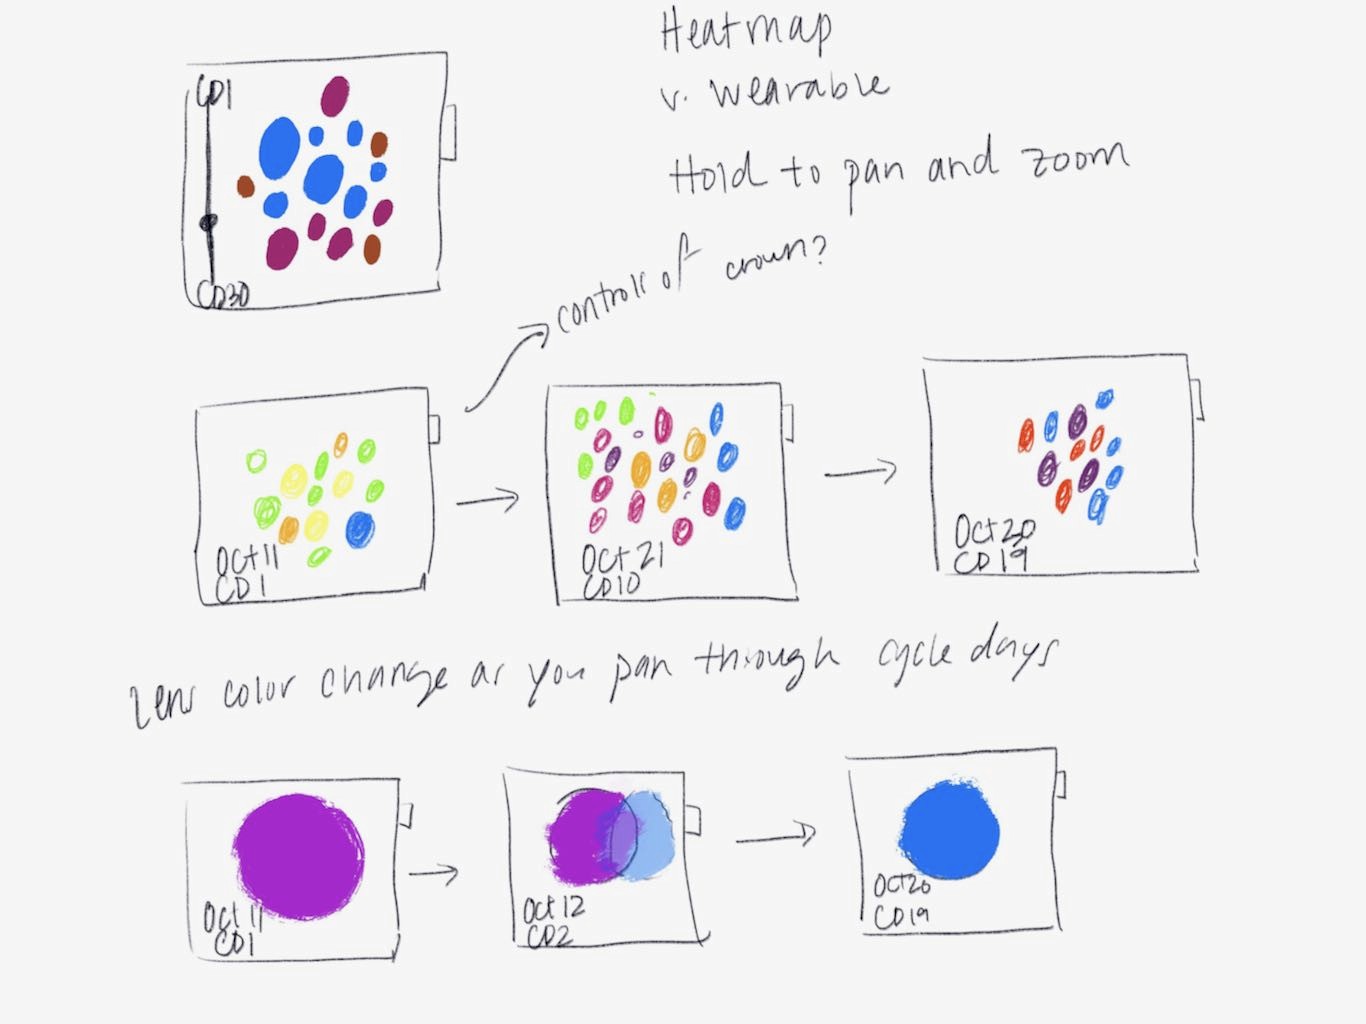
I wanted to take advantage of existing interaction patterns from the iOS Calendar application that users are already familiar with and allow users to pan in and out of their timeline without adding extra icons to the interface. Initially, I brainstormed the calendar view in black and white to see if lines and shapes could communicate patterns without any color application.
Elements
Tags
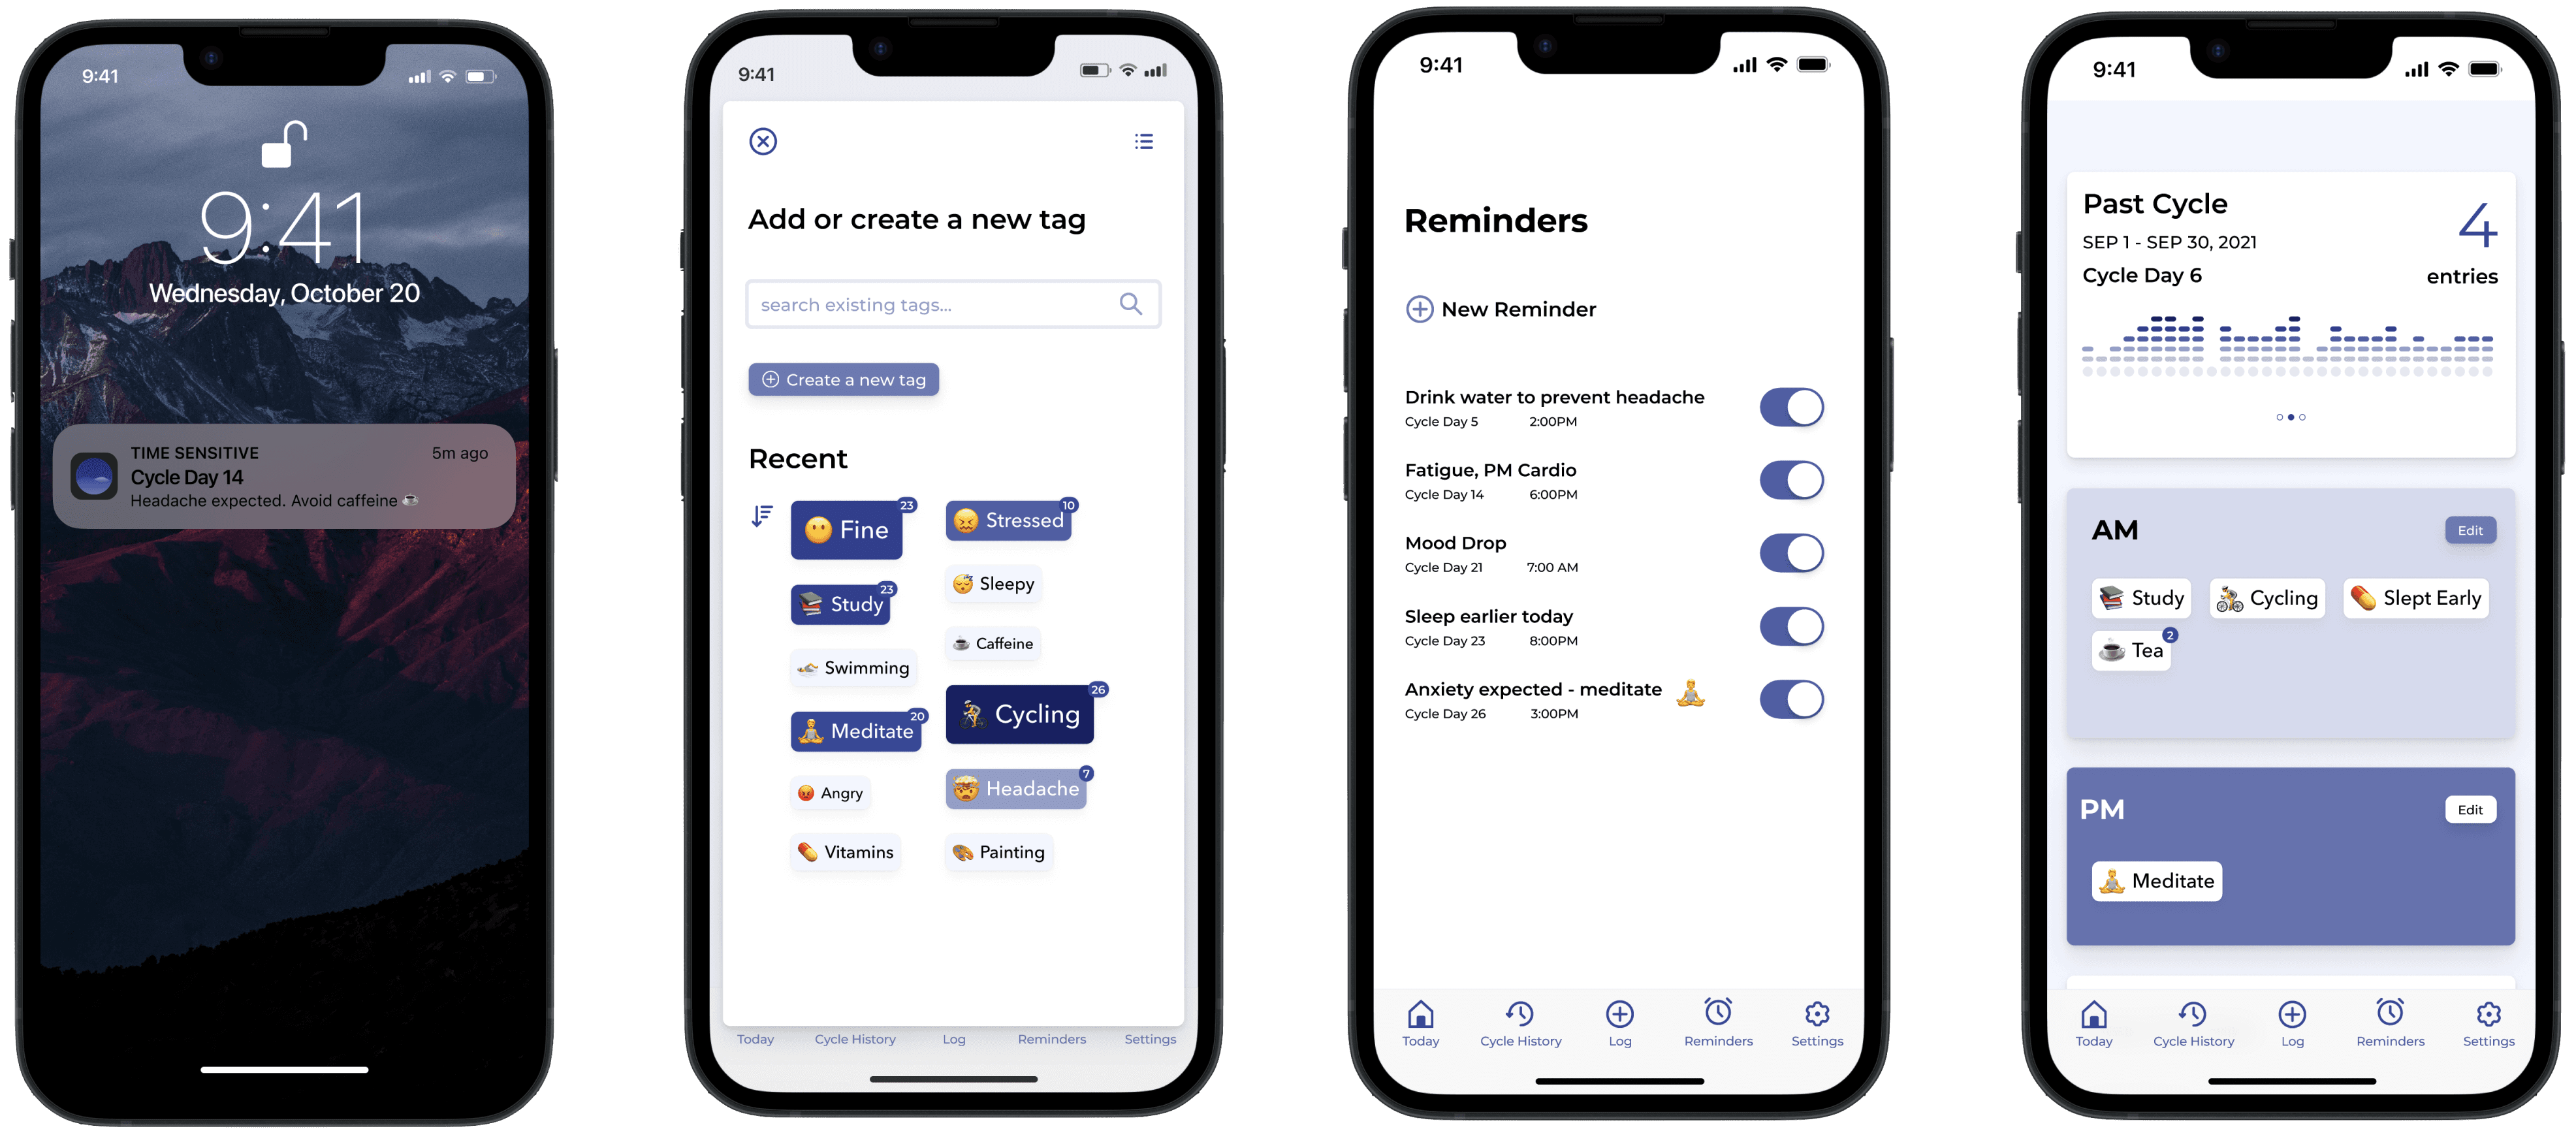
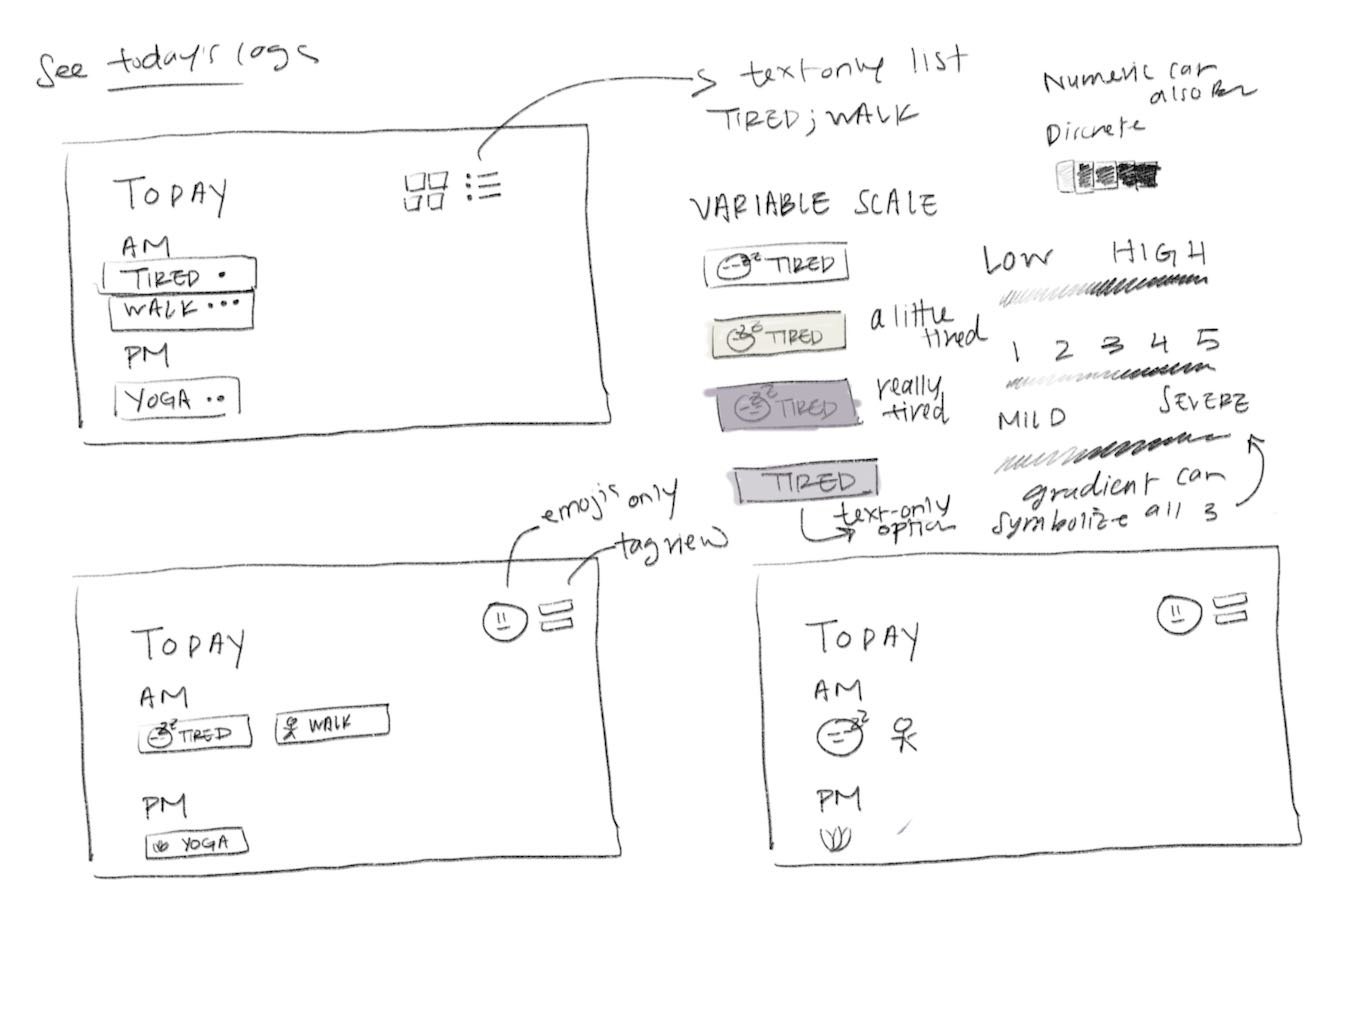
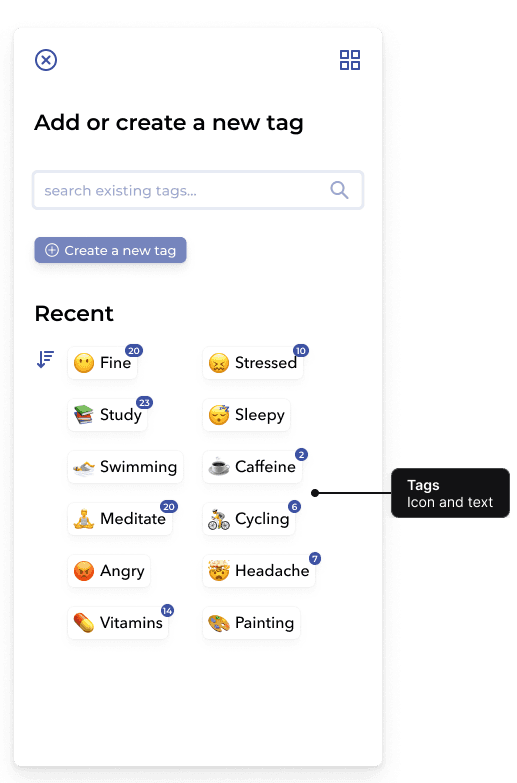
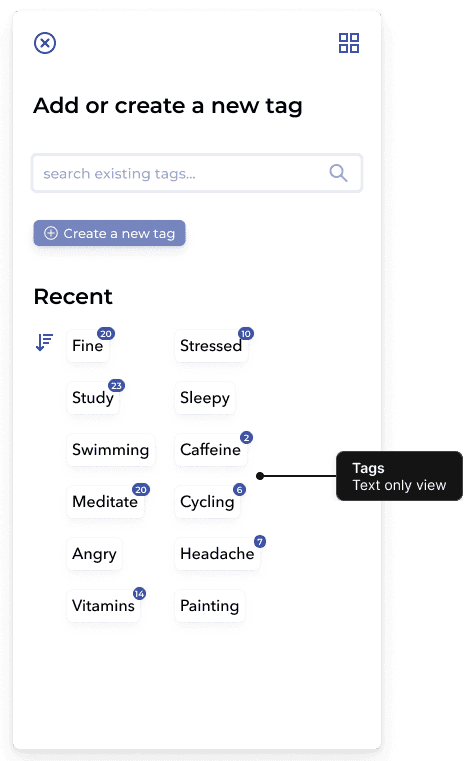
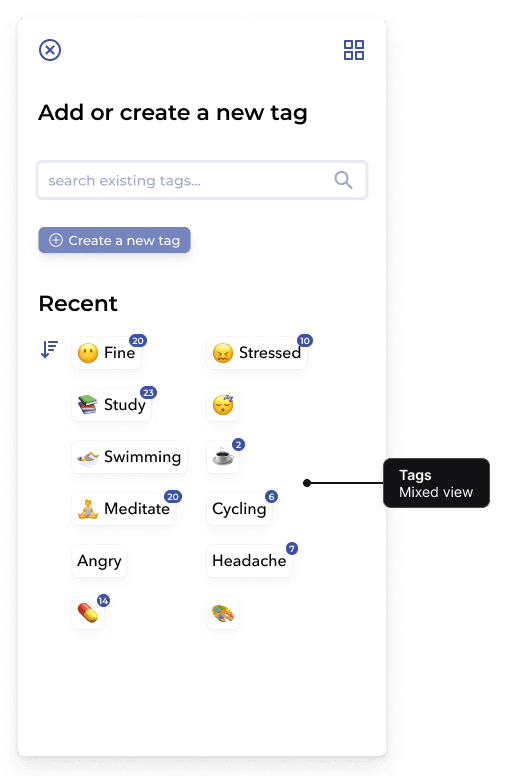
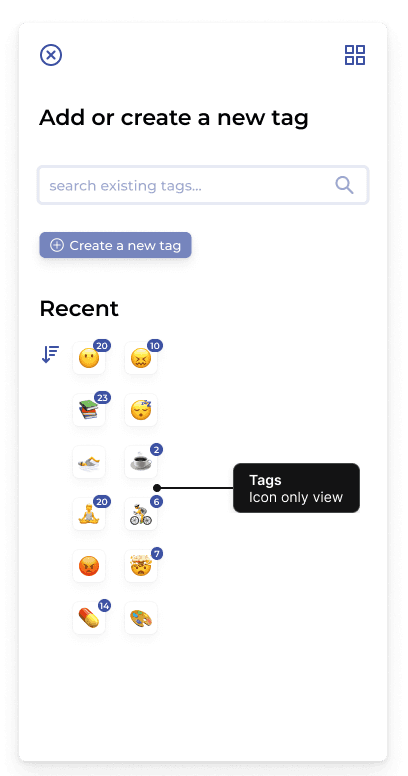
Tags are the foundational data structure in this application, allowing users to customize what they want to track without needing to maintain separate categories or groups. The app gives users the option to create fixed tags or variable tags so that they can track symptoms that have different severity levels. Tags are designed to give users visual control when they view multiple tags logged in the application. For example, some users prefer only viewing icons, while others prefer just text. Allowing a text-only view of logged data can also be more accessible to a broader range of audiences.
Cards
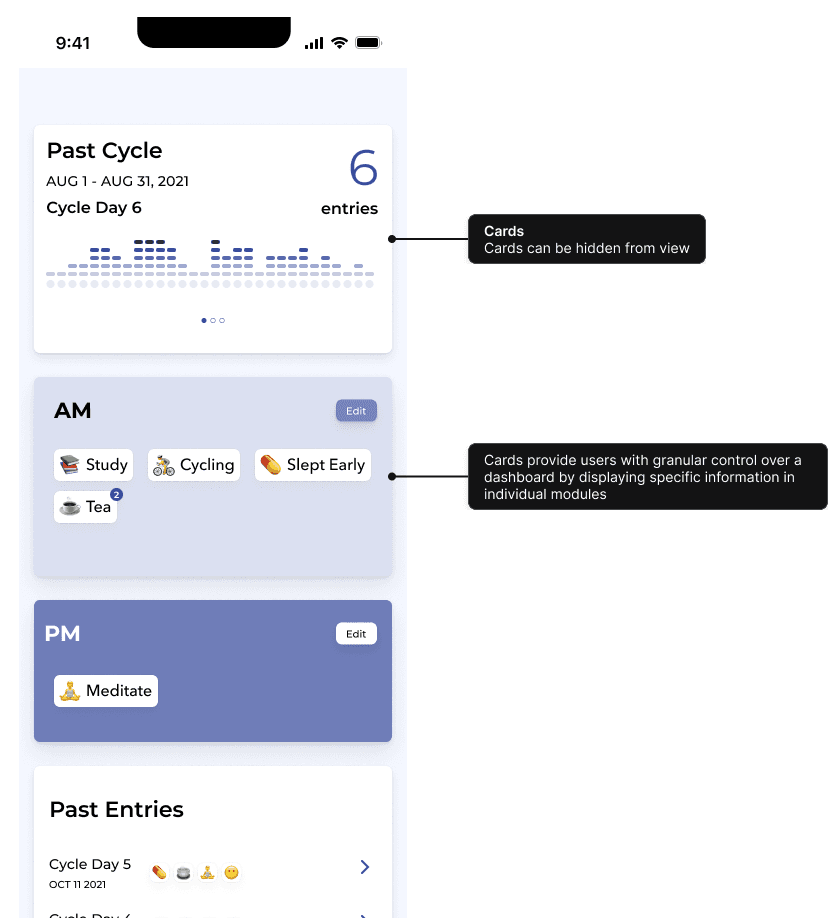
Cards give users control over what they want to display on their dashboard.
Features
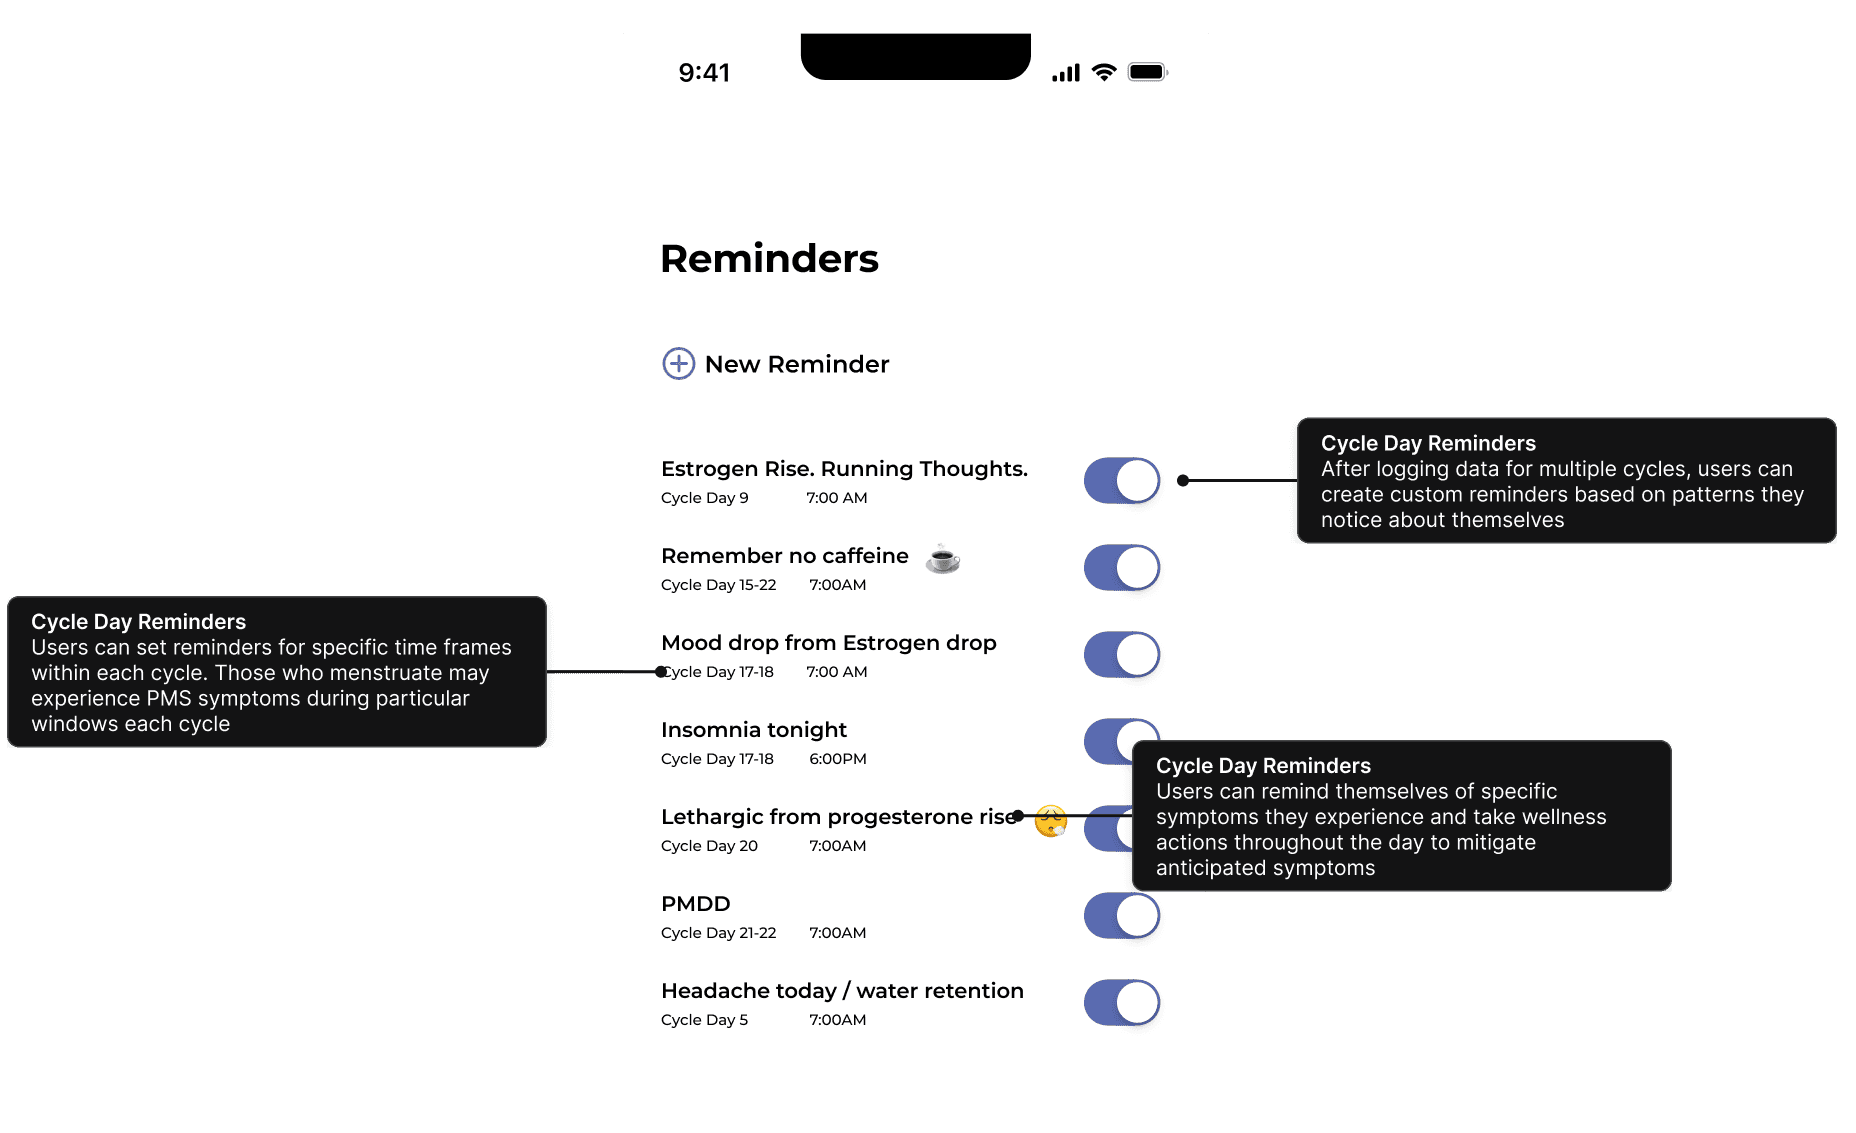
Cycle-date reminders
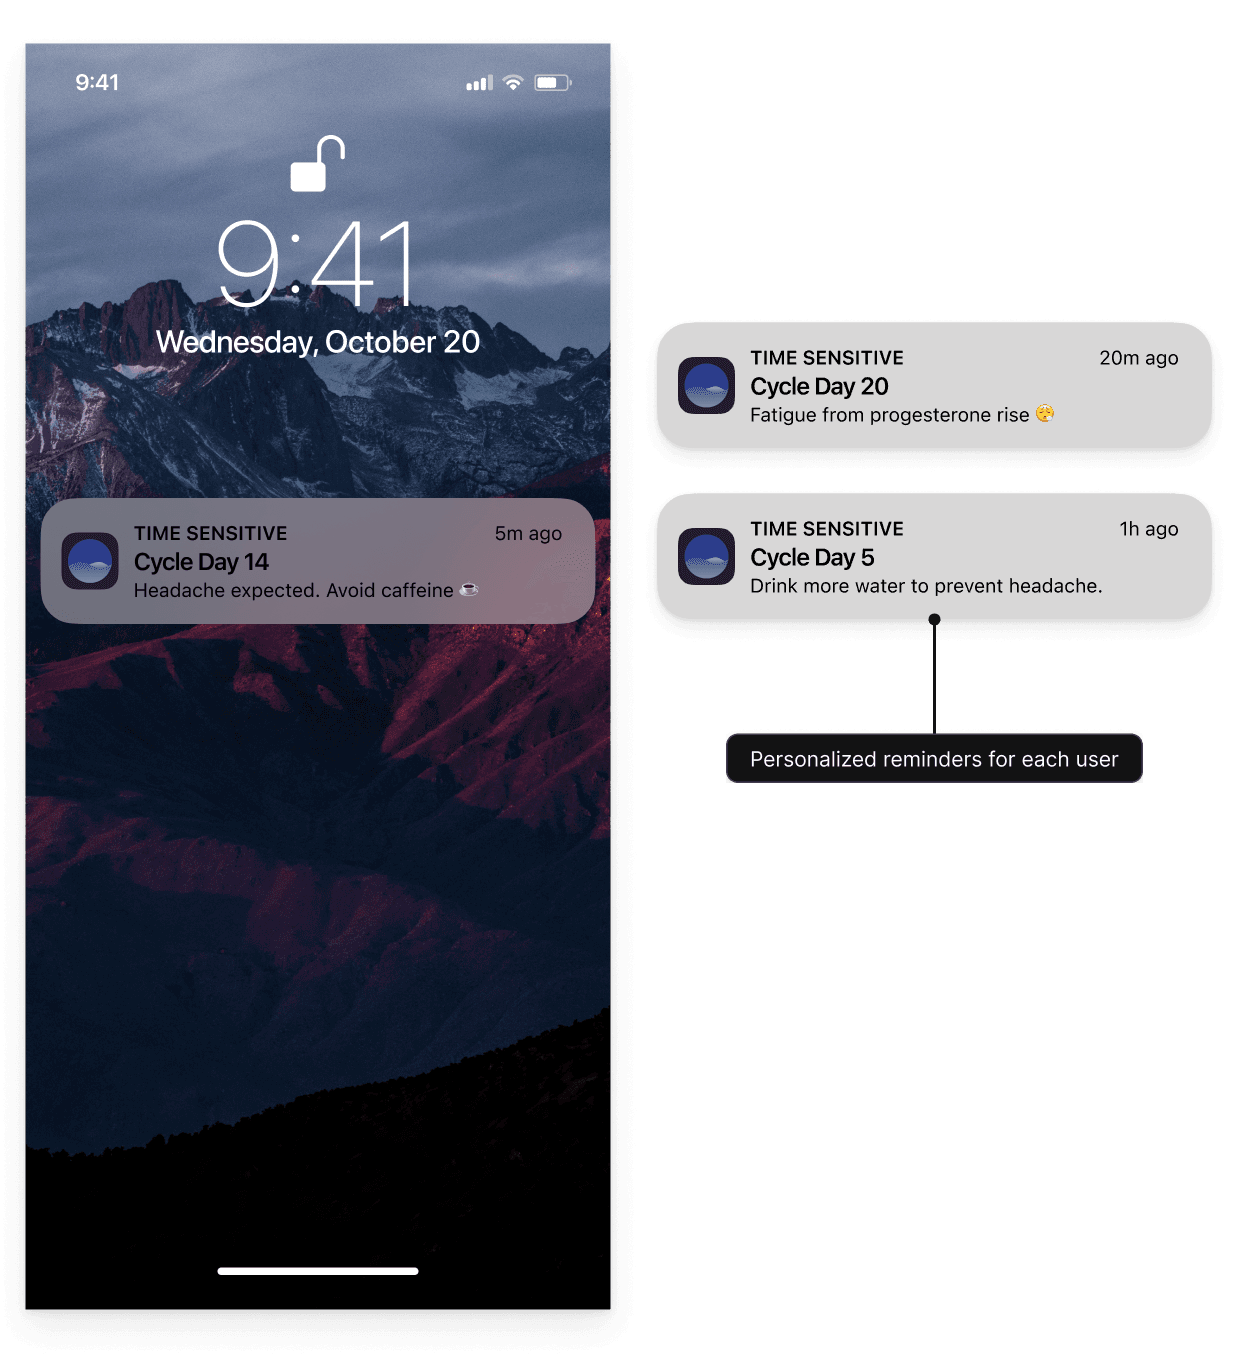
Cycle-date reminders are notifications that alert users on a specific day of their cycle, rather than a specific date on a calendar. They are particularly useful for tracking the menstrual cycle, which often follows repeating patterns that don't align with the Gregorian calendar.
Cards
Cards give users control over what they want to display on their dashboard.
Design Solution
Create tags to log anything
Create fixed or variable tags to track activities, moods, and energy levels
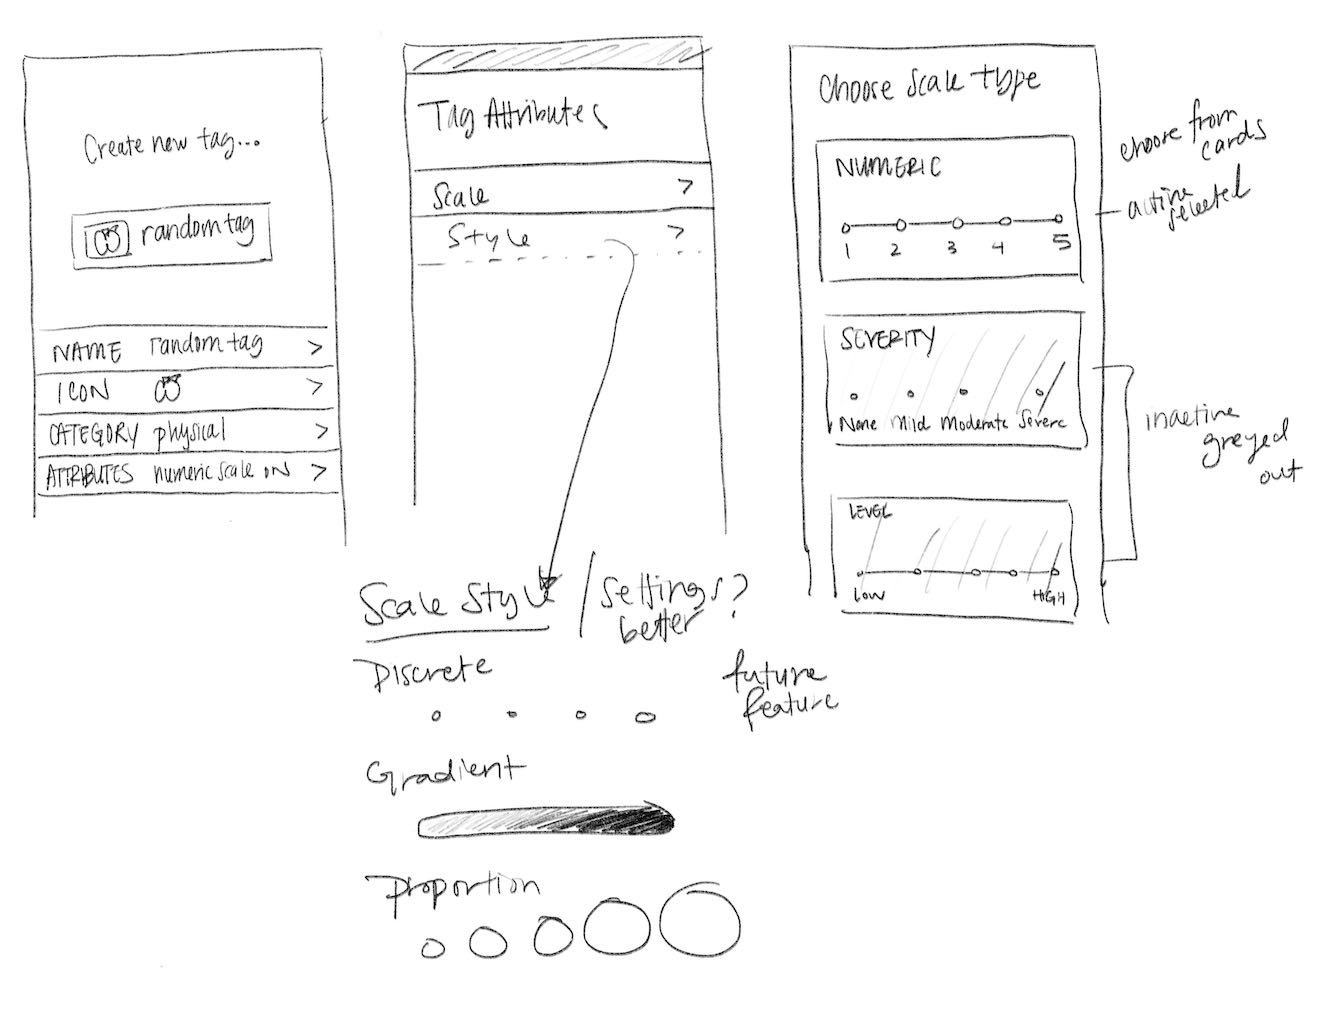
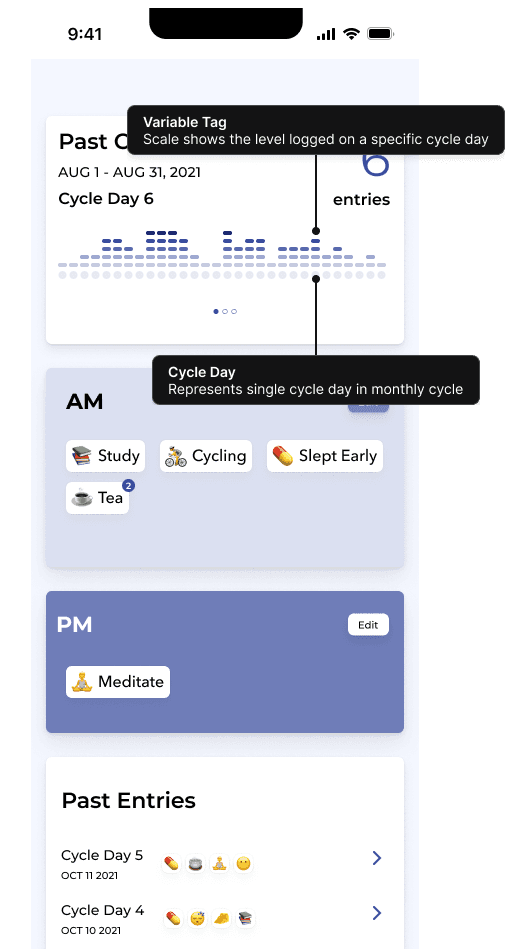
Variable tags have different scale types that offer more nuanced tracking
Search logged tags with data visualization
Search existing tags with added visualization
Tags in trends view are displayed in proportion to their logged frequency through darker colors and larger size
Customize cycle day reminders
Set reminders for menstrual or any type of cycle
Cycle reminders are not fixed to a specific calendar date
View trends across cycle history
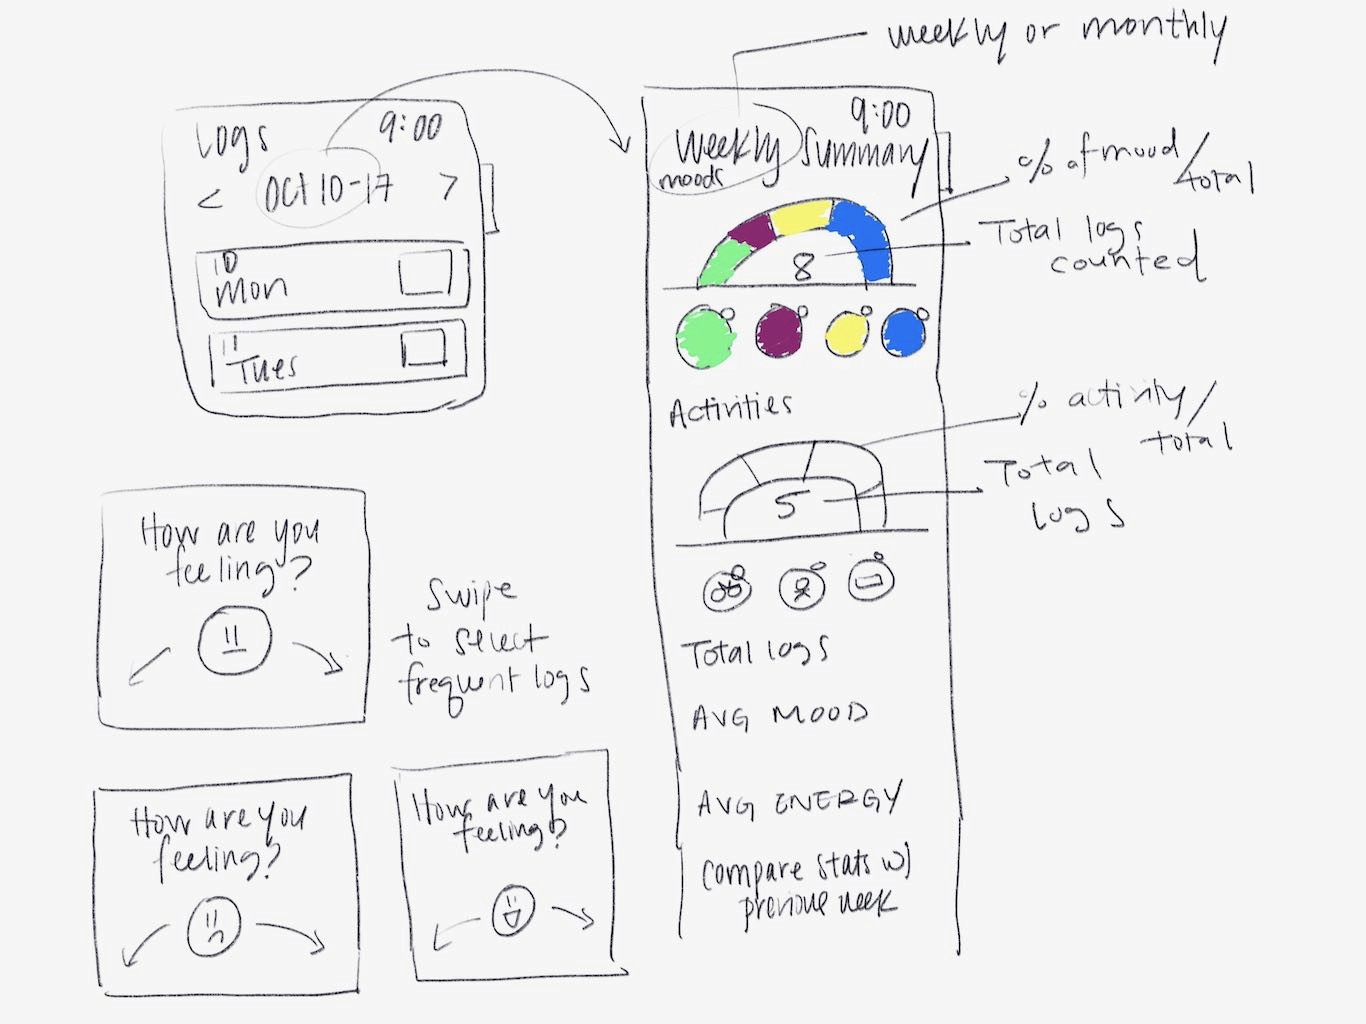
View tracking history by month or by cycle
Monitor how variable tags change over time and identify patterns
Drill down from monthly overview to view logged tags for a particular day
Explore logged data to find patterns
Other Explorations
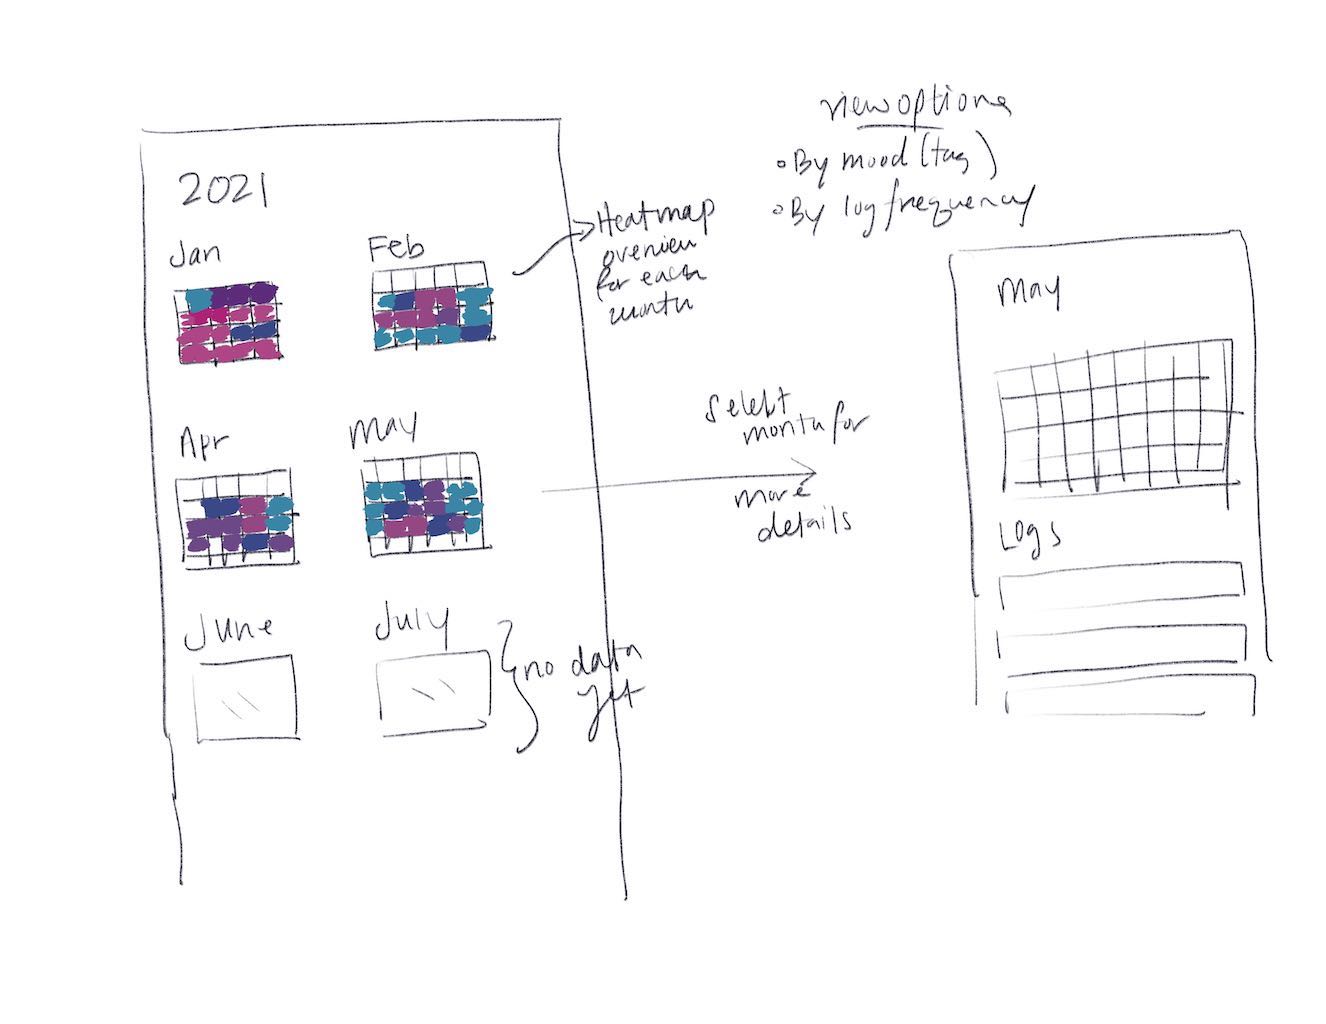
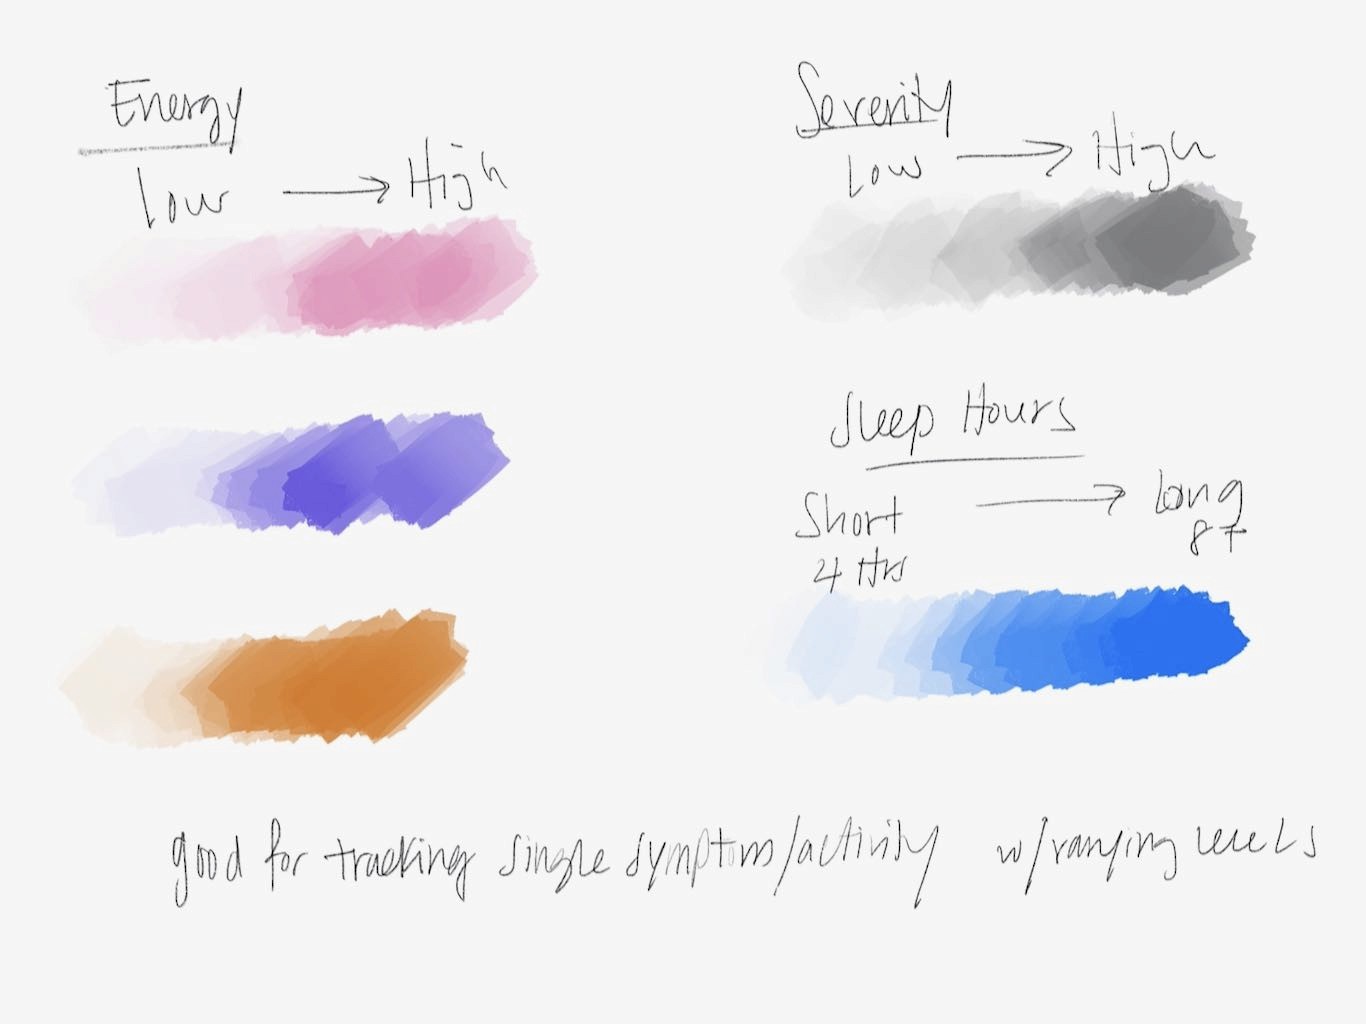
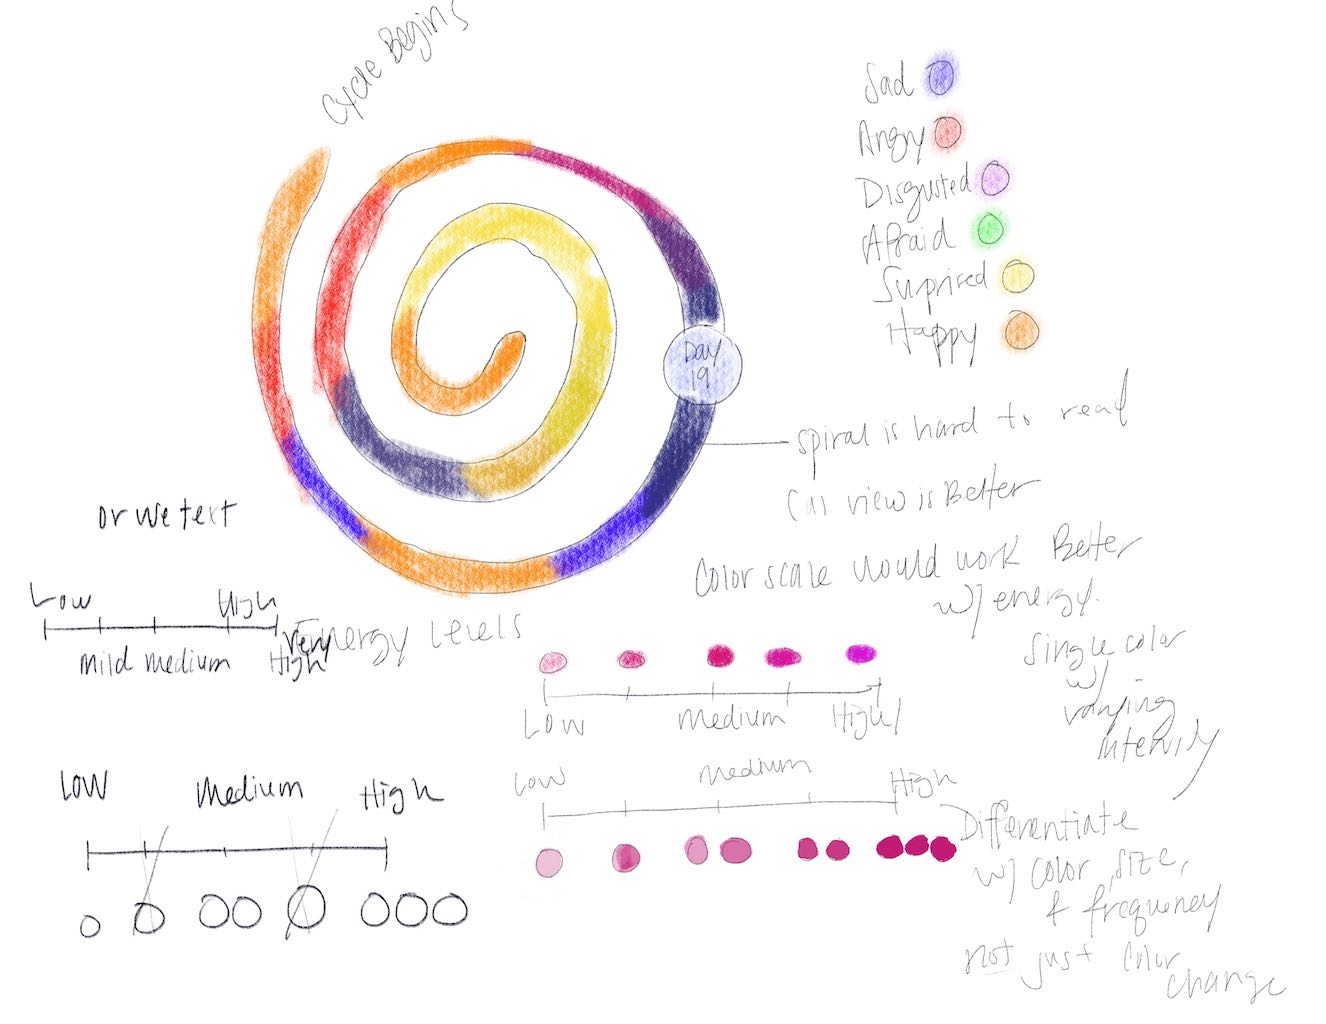
Sketches to explore how to display tracked symptoms in a minimal but meaningful way.
Reflection
This project introduced me to the design thinking process, where I quickly learned how valuable prototyping and ideation are for exploring ideas without committing to costly high-fidelity models. User research guided design choices, but testing with target users is necessary to validate my hypothesis that data visualization in repetitive actions would facilitate faster and more effortless insight discovery. The project also taught me about scope management. My original plan of creating a cross-platform application, including wearable and desktop versions, was not feasible for this project's timeline. Instead, I focused on creating a mobile application since it's the most convenient and accessible option for users.
Next Steps
Test prototype with target users
Conduct accessibility audits
Improve data visualization
Identify key features and interaction framework for wearables
Design a help interface for first-time users
References
R. Zhang, K. E. Ringland, M. Paan, D. C. Mohr, and M. Reddy, “Designing for emotionalwell-being: Integrating persuasion and customization into mental health technologies,” 2021. doi: 10.1145/3411764.3445771.
Y. Liu, “A Holistic Framework for Designing Mental Health Technology,” Massachusetts Institute of Technology, 2022.
K. Wang, D. S. Varma, and M. Prosperi, “A systematic review of the effectiveness of mobile apps for monitoring and management of mental health symptoms or disorders,” Journal of Psychiatric Research, vol. 107. 2018. doi: 10.1016/j.jpsychires.2018.10.006.
M. Boukhechba, A. R. Daros, K. Fua, P. I. Chow, B. A. Teachman, and L. E. Barnes, “DemonicSalmon: Monitoring mental health and social interactions of college students using smartphones,” Smart Health, vol. 9–10, 2018, doi: 10.1016/j.smhl.2018.07.005.
“MenstrualCycle2 En.svg.” Wikipedia Commons, Isometrik, 8 Dec. 2009, https://commons.wikimedia.org/wiki/File:MenstrualCycle2_en.svg. Accessed 1 Nov. 2021.
